GEOSPATIAL INTERPOLATION
This project measures the predictive quality of three common geospatial models: Kriging, Spline, and Inverse Distance Weighting (IDW) to create continuous temperature surfaces from weather station observations across the United States.
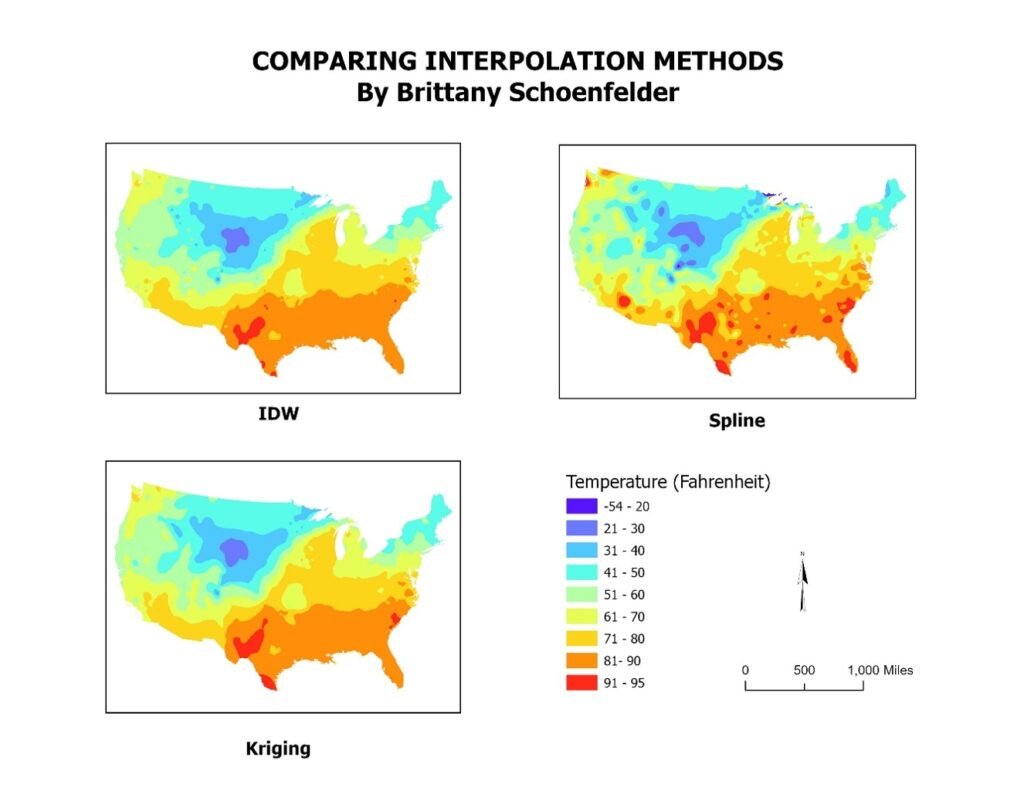
Weather station observations (vector point data) were imported into ArcGIS Pro and filtered to valid temperature records collected between 1945 and 1960. Ten weather stations were reserved as test points to evaluate model accuracy, while the remaining observation points were used for creating the interpolation models. Each method produced a continuous raster surface representing estimated temperature across the study area, shown in the figure below:
Model Comparison….
IDW statistics appear to match the original points feature class statistics the closest. This method benefits from the dense sampling made possible with this data.
Spline statistics vary the most in the min and max compared to the original points statistics. Perhaps this is due to the model’s ability to estimate above maximum points and below minimum points.
Kriging statistics also match the original points feature class statistics closely. Kriging does not pass through any of the original points and causes interpolated values to be higher or lower than real values. Kriging and IDW are similar in that they both establish weights from surrounding measured values, but Kriging also accounts for spatial correlation.
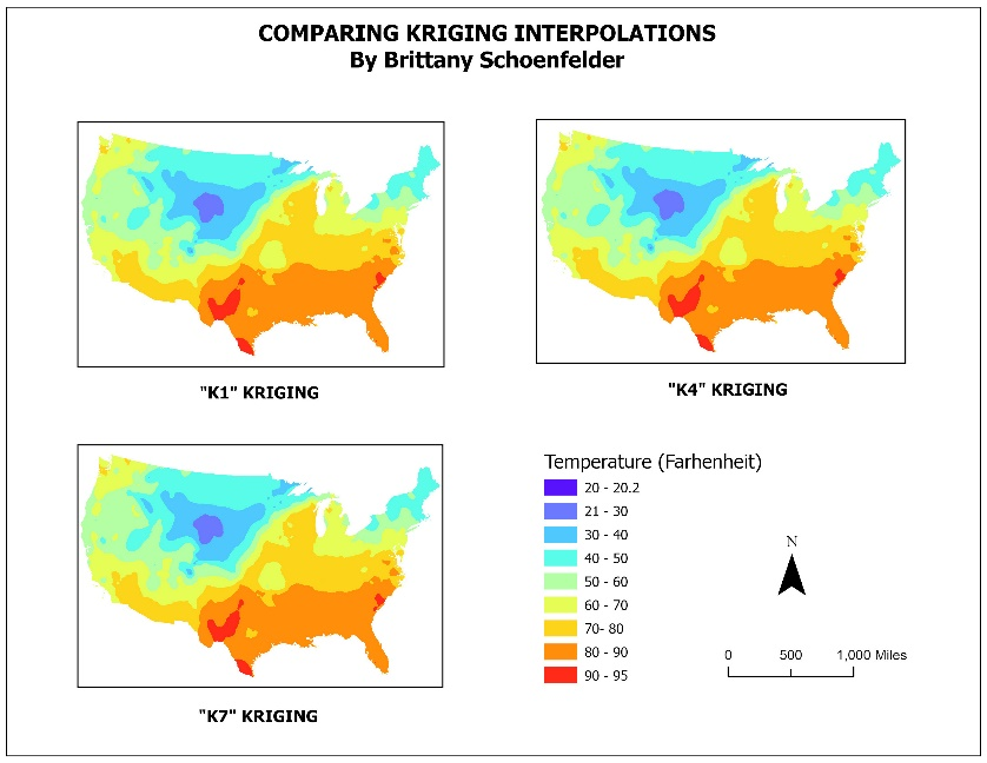
Based on the validation results, Kriging was selected as the preferred interpolation method. This method was then further optimized by refining the interpolation parameters, including the semi-variogram model, output cell size, and search radius (number of points and maximum distance.) The figure below shows the refined results: