LAND COVER CHANGE
The region and city of Dubai has experienced rapid and dramatic urban development in recent decades, including the construction of the Palm Islands land-reclamation project. This study uses Google Earth Engine (GEE) to explore how Dubai’s landscape has changed over the span of forty years, through two satellite-derived indices: the Normalized Difference Vegetation Index (NDVI) and the Normalized Difference Water Index (NDWI).
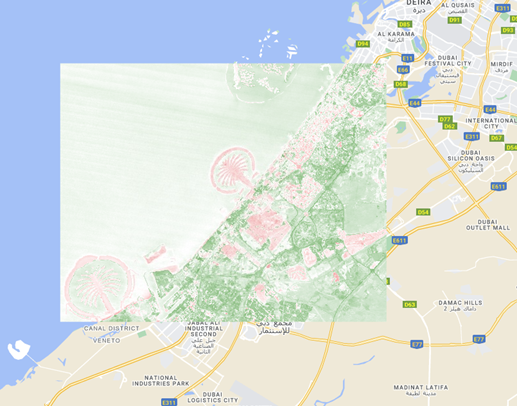
NDVI measures the presence and health of vegetation. In the map above, higher NDVI values appear as green areas, representing healthier or denser vegetation, while lower values appear as red tones. In Dubai, NDVI remains mostly stable over the study period, with one noticeable drop around 2004. This aligns with the construction of the Palm Islands, when vegetation was minimal during land development. As landscaping and planted vegetation were added to the islands, NDVI values gradually returned to typical levels.
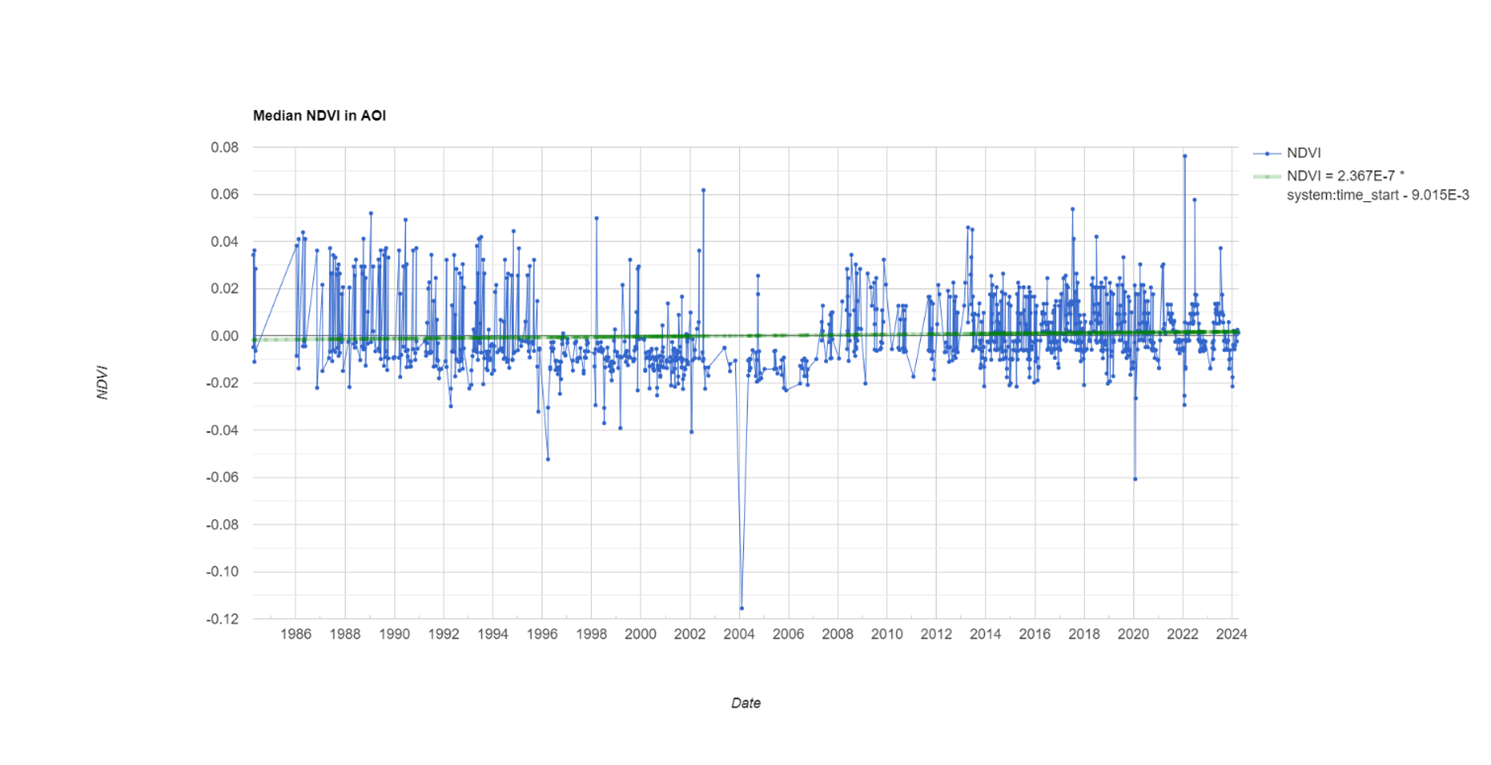
This line chart displays the median NDVI for each year. Using the median helps smooth out noise from clouds or unusual pixel values, making long-term trends easier to see. The drop in 2004 reflects construction disturbance, followed by vegetation recovery as development stabilized.
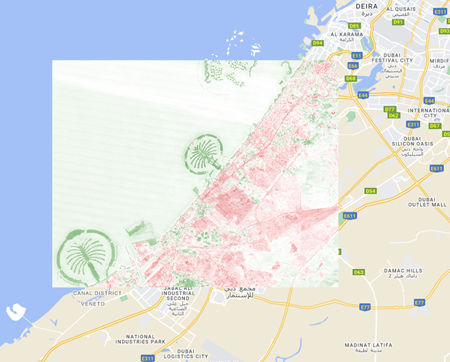
NDWI highlights water bodies and moisture-rich surfaces. Unlike NDVI, the NDWI mapped above shows a clearer downward trend across Dubai during the study period. As the city expanded, natural moisture-holding surfaces were replaced with built infrastructure, contributing to this decline.
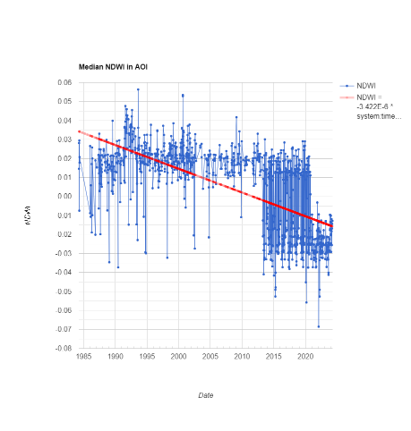
The NDWI chart shows a steady decline in moisture-related surfaces. This pattern corresponds with ongoing urbanization and shoreline modification. Some small increases appear on the Palm Islands, likely due to irrigation and landscaping along the coastline.
In GEE, the function ee.Reducer.median() calculates the median pixel value for each year of imagery. This is effective in cutting out cloud-covered pixels and other visual noise, and produces a cleaner, more reliable chart for a time series land cover analysis.
RADIOMETRIC NORMALIZATION
Radiometric normalization corrects for atmospheric effects, illumination differences, and sensor variability between satellite images from the same season. It adjusts the pixel values in one raster image to match the radiometric conditions of a reference image, making multiple images more consistent for use in a single mosaic. This allows for improved image classification and change detection.
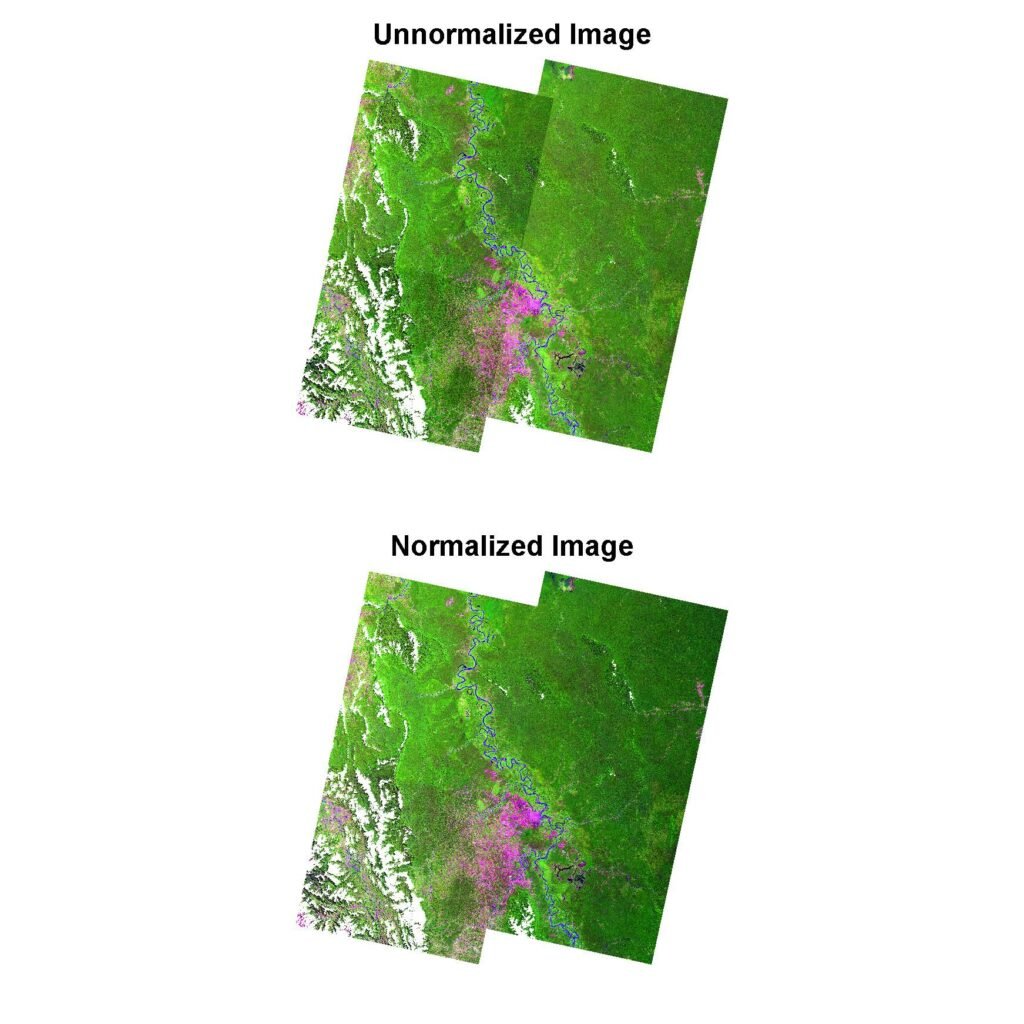
This study uses adjacent Landsat 8 images of the Peruvian Amazon from Earth Explorer (USGS) acquired on different days within a month from each other in the Fall of 2023. The imagery was processed in R to remove cloud and shadow contamination, and to normalize the overlapping pixels between scenes to create a seamless, radiometrically consistent mosaic. The figure below compares the results before and after normalization: the top image shows the scenes merged together without normalization, and the bottom image shows the normalized mosaic.