VECTOR ANALYSIS
Location Suitability Analysis for a New Recycling Facility in Tucson, AZ
by Brittany Schoenfelder
Abstract:
The city of Tucson, AZ could benefit from having another public recycling facility to encourage residents to recycle. This study explores potential sites for a public recycling facility using location suitability analysis. Two methods, Boolean and Weighted/Ranked Suitability, are compared for a comprehensive analysis of optimal locations. Suitable locations are defined by specific criteria.
Objective:
To find an optimal location for a new recycling collection facility in Tucson using location suitability analysis based on population density, road networks for ease of access, distance from existing recycling centers, and proximity to schools.
Study Area (Pictured Below):
Tucson Neighborhood Districts (Total Count of 159) in Pima County, Arizona (Tucson)
Data:
Datasets for this analysis include the Tucson Neighborhood Districts (study area), streets/major roadways, general census data, population, Pima County schools and existing recycling facilities; acquired from public databases such as the City of Tucson and the Pima County Geospatial Data Portal.
Neighborhood Population Statistics (from the City of Tucson) show the population counts in Tucson by neighborhood. Population density is expressed as persons per square mile. Tucson has an average population density of 4,682 people per square mile, as recorded in the attribute table. This value is useful in determining a minimum population density as criteria for a new recycling facility location.
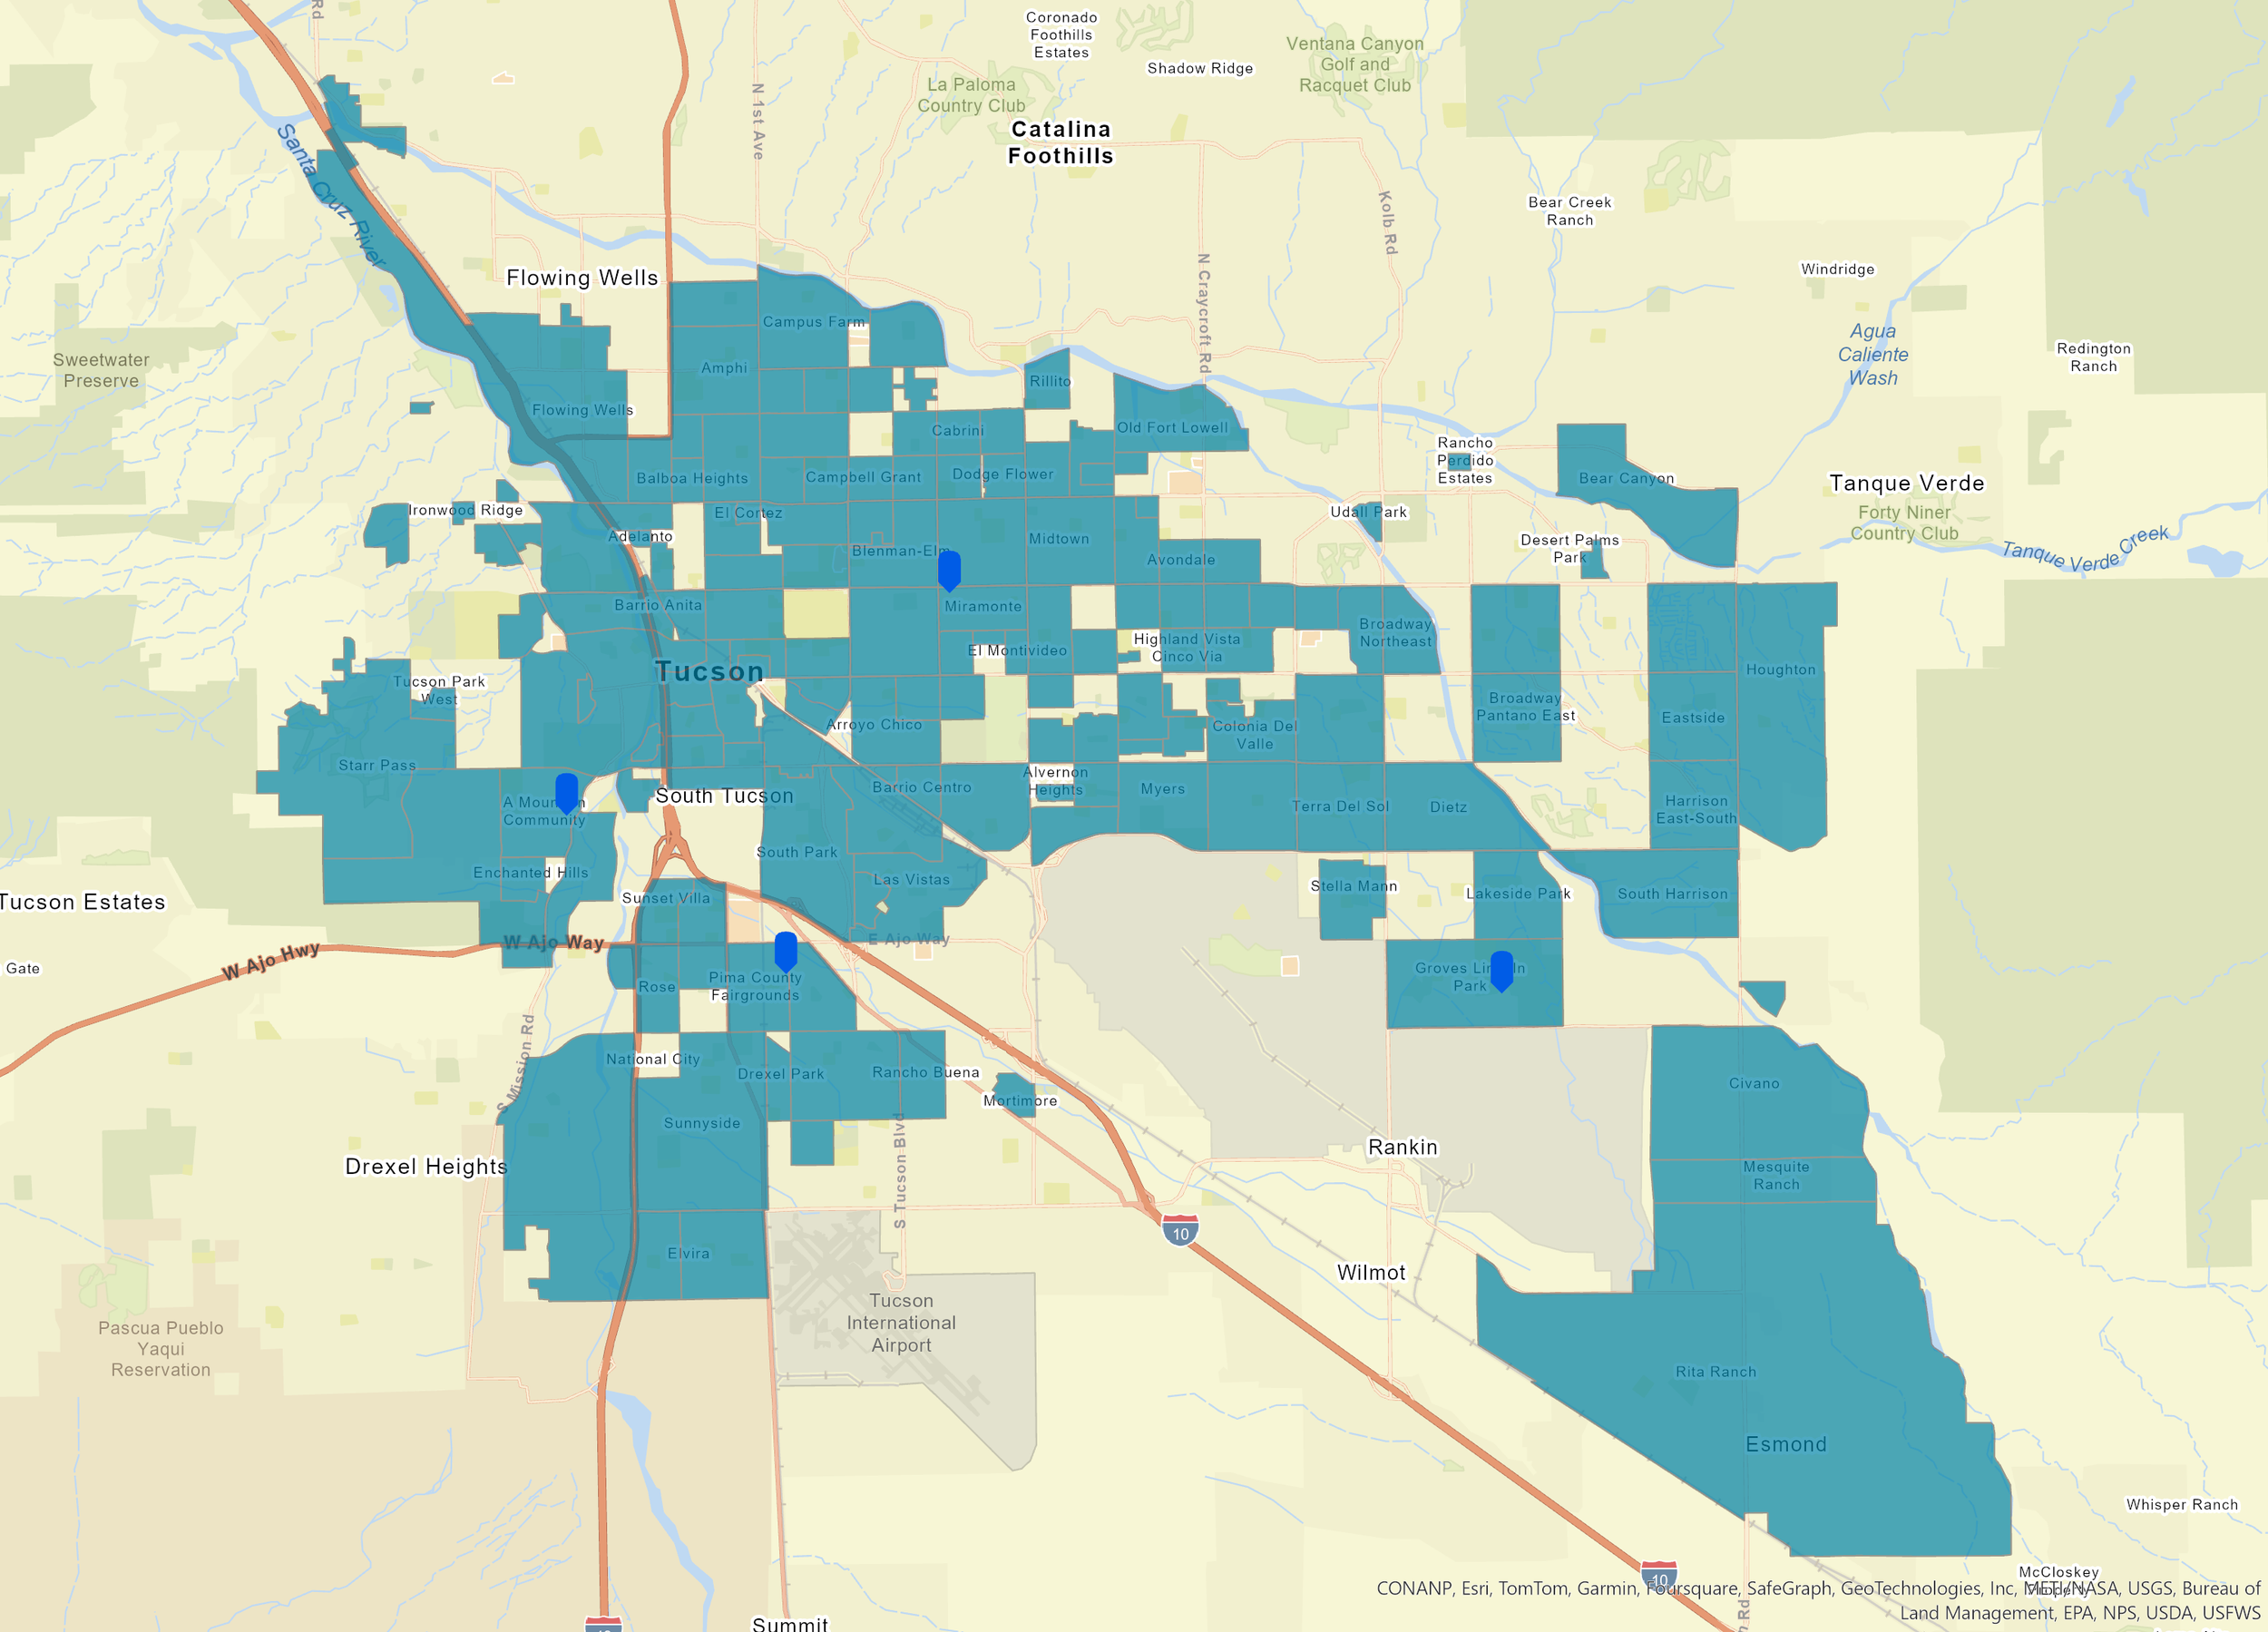
A search for existing neighborhood recycling facilities in Tucson returned 4 addresses within this study area from the City of Tucson website:
1925 S. San Antonio Dr. (behind Tucson Fire Dept., Station 15)
Ward 4 Council Office, 8155 E. Poinciana Dr.
Ward 5 Council Office, 4300 S. Park Ave.
Ward 6 Council Office, 3202 E. 1st St.
These addresses and their respective coordinates were entered into a spreadsheet (CSV) to digitize and use as input criteria for this analysis. This data was converted to points in ArcGIS Pro as a feature layer. The four existing neighborhood recycling facilities in Tucson are marked with blue pins on the following map of the study area of Tucson Neighborhood Districts:
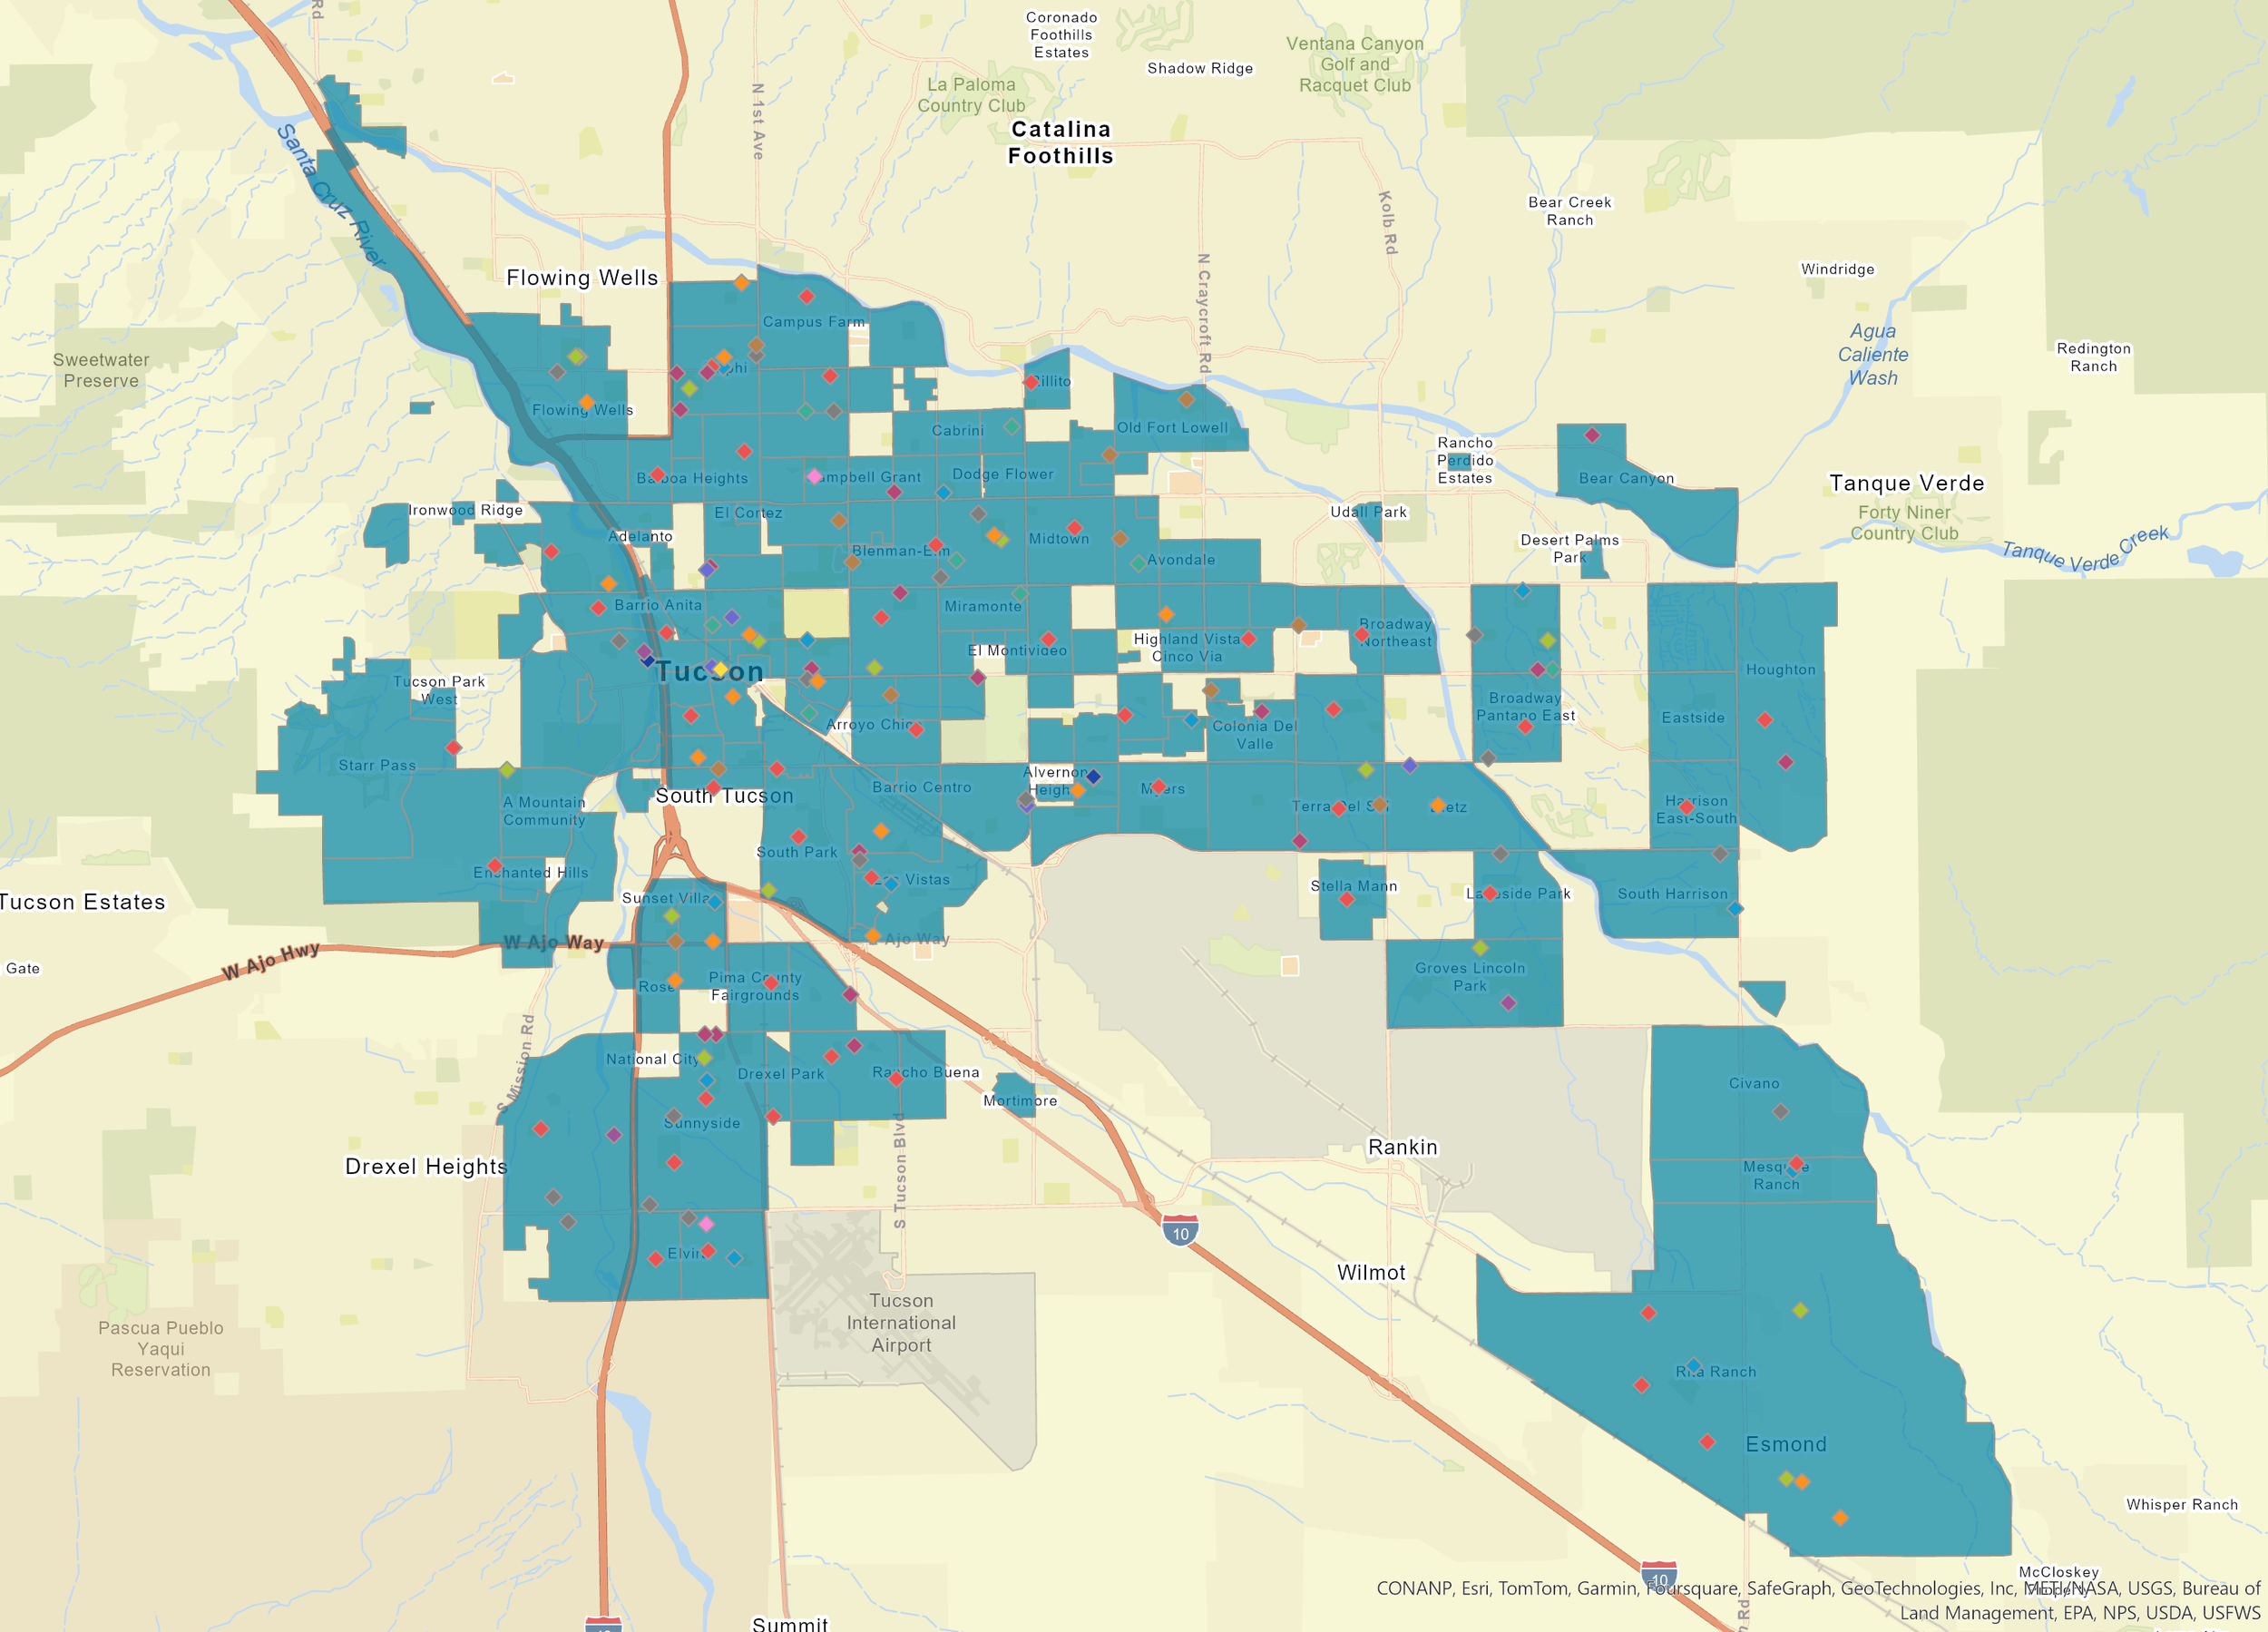
A shapefile of Pima County schools was found in the ArcGIS Online Portal. It includes data points for elementary, middle, high, college and university. This feature layer was clipped to the extent of the study area using the Clip tool. Locating a new recycling facility near schools will not only support the bulk waste processing needed but also set a positive example for students in academia and encourage the practice of recycling amongst young people. Pima County schools within the study area are marked with colored diamonds on the following map:
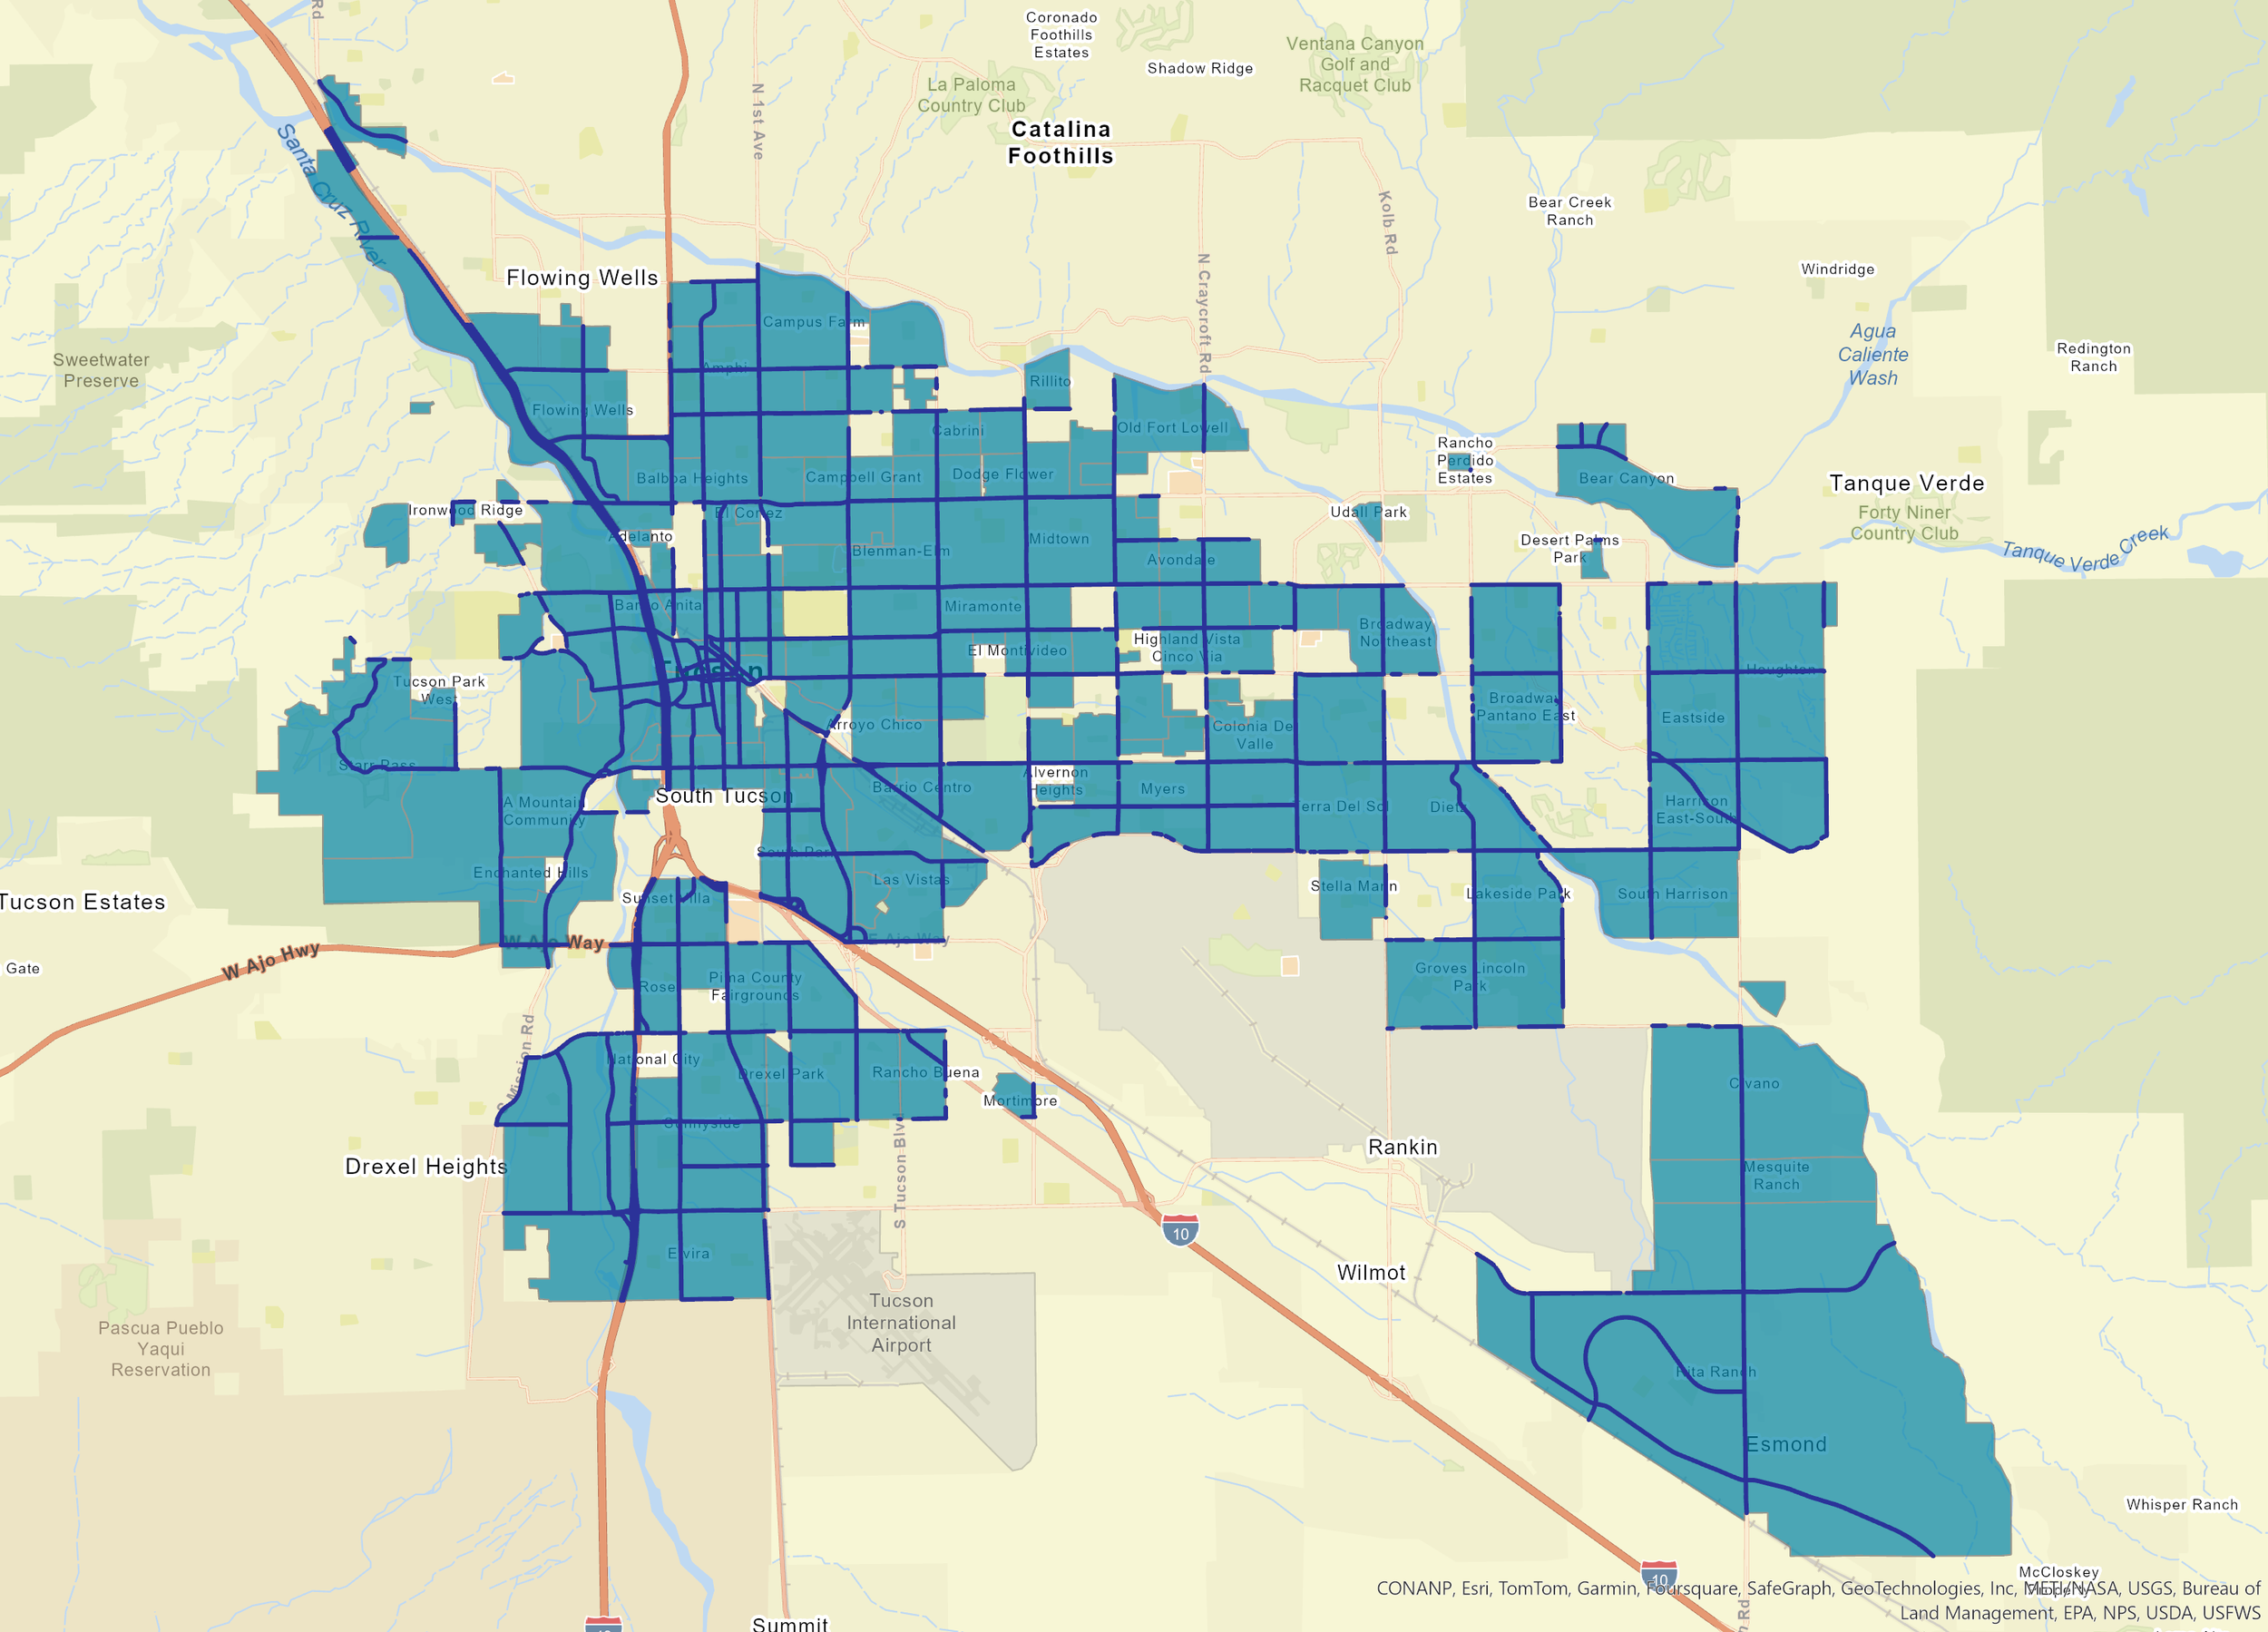
Major roadways in the study area are marked in dark blue in the following map:
Analysis & Results:
After acquiring data, the ‘cleaning’ process involves projecting all data to NAD 1983 HARN StatePlane Arizona Central FIPS 0202 (Intl Feet) and clipping data to the study area extent. Criteria are determined and prepared for input; These criteria will ensure that the facility location is accessible and in an area of high demand. The Boolean method will produce an output of locations which meet all criteria, while the Weighted/Ranked method will allow for prioritization of certain criteria over others, with the potential for many different outcomes.
Boolean Suitability Modeling
The first part of this analysis aims to apply Boolean Suitability Modeling to identify best places to open a new recycling facility in Tucson, AZ. Boolean models will return true or valse values regarding specific conditions/criteria.
Suitable locations are defined by the following criteria:
1) The facility must be within a Pima County neighborhood with a population density of at least 5,000 people per square mile
2) The facility should be within a 0.5-mile distance from major roadways
3) The facility should be located outside a 2-mile distance from existing recycling centers
4) The facility should be within a 0.5-mile distance from a public school
Criterion #1: The facility must be within a Pima County neighborhood with a population density of at least 5,000 people per square mile. The facility should be accessible to as many people as possible, so a neighborhood with a higher population density than the average (4,682 people per square mile) is ideal. The minimum population density is set to 5,000 people per square mile, to meet the average at least.
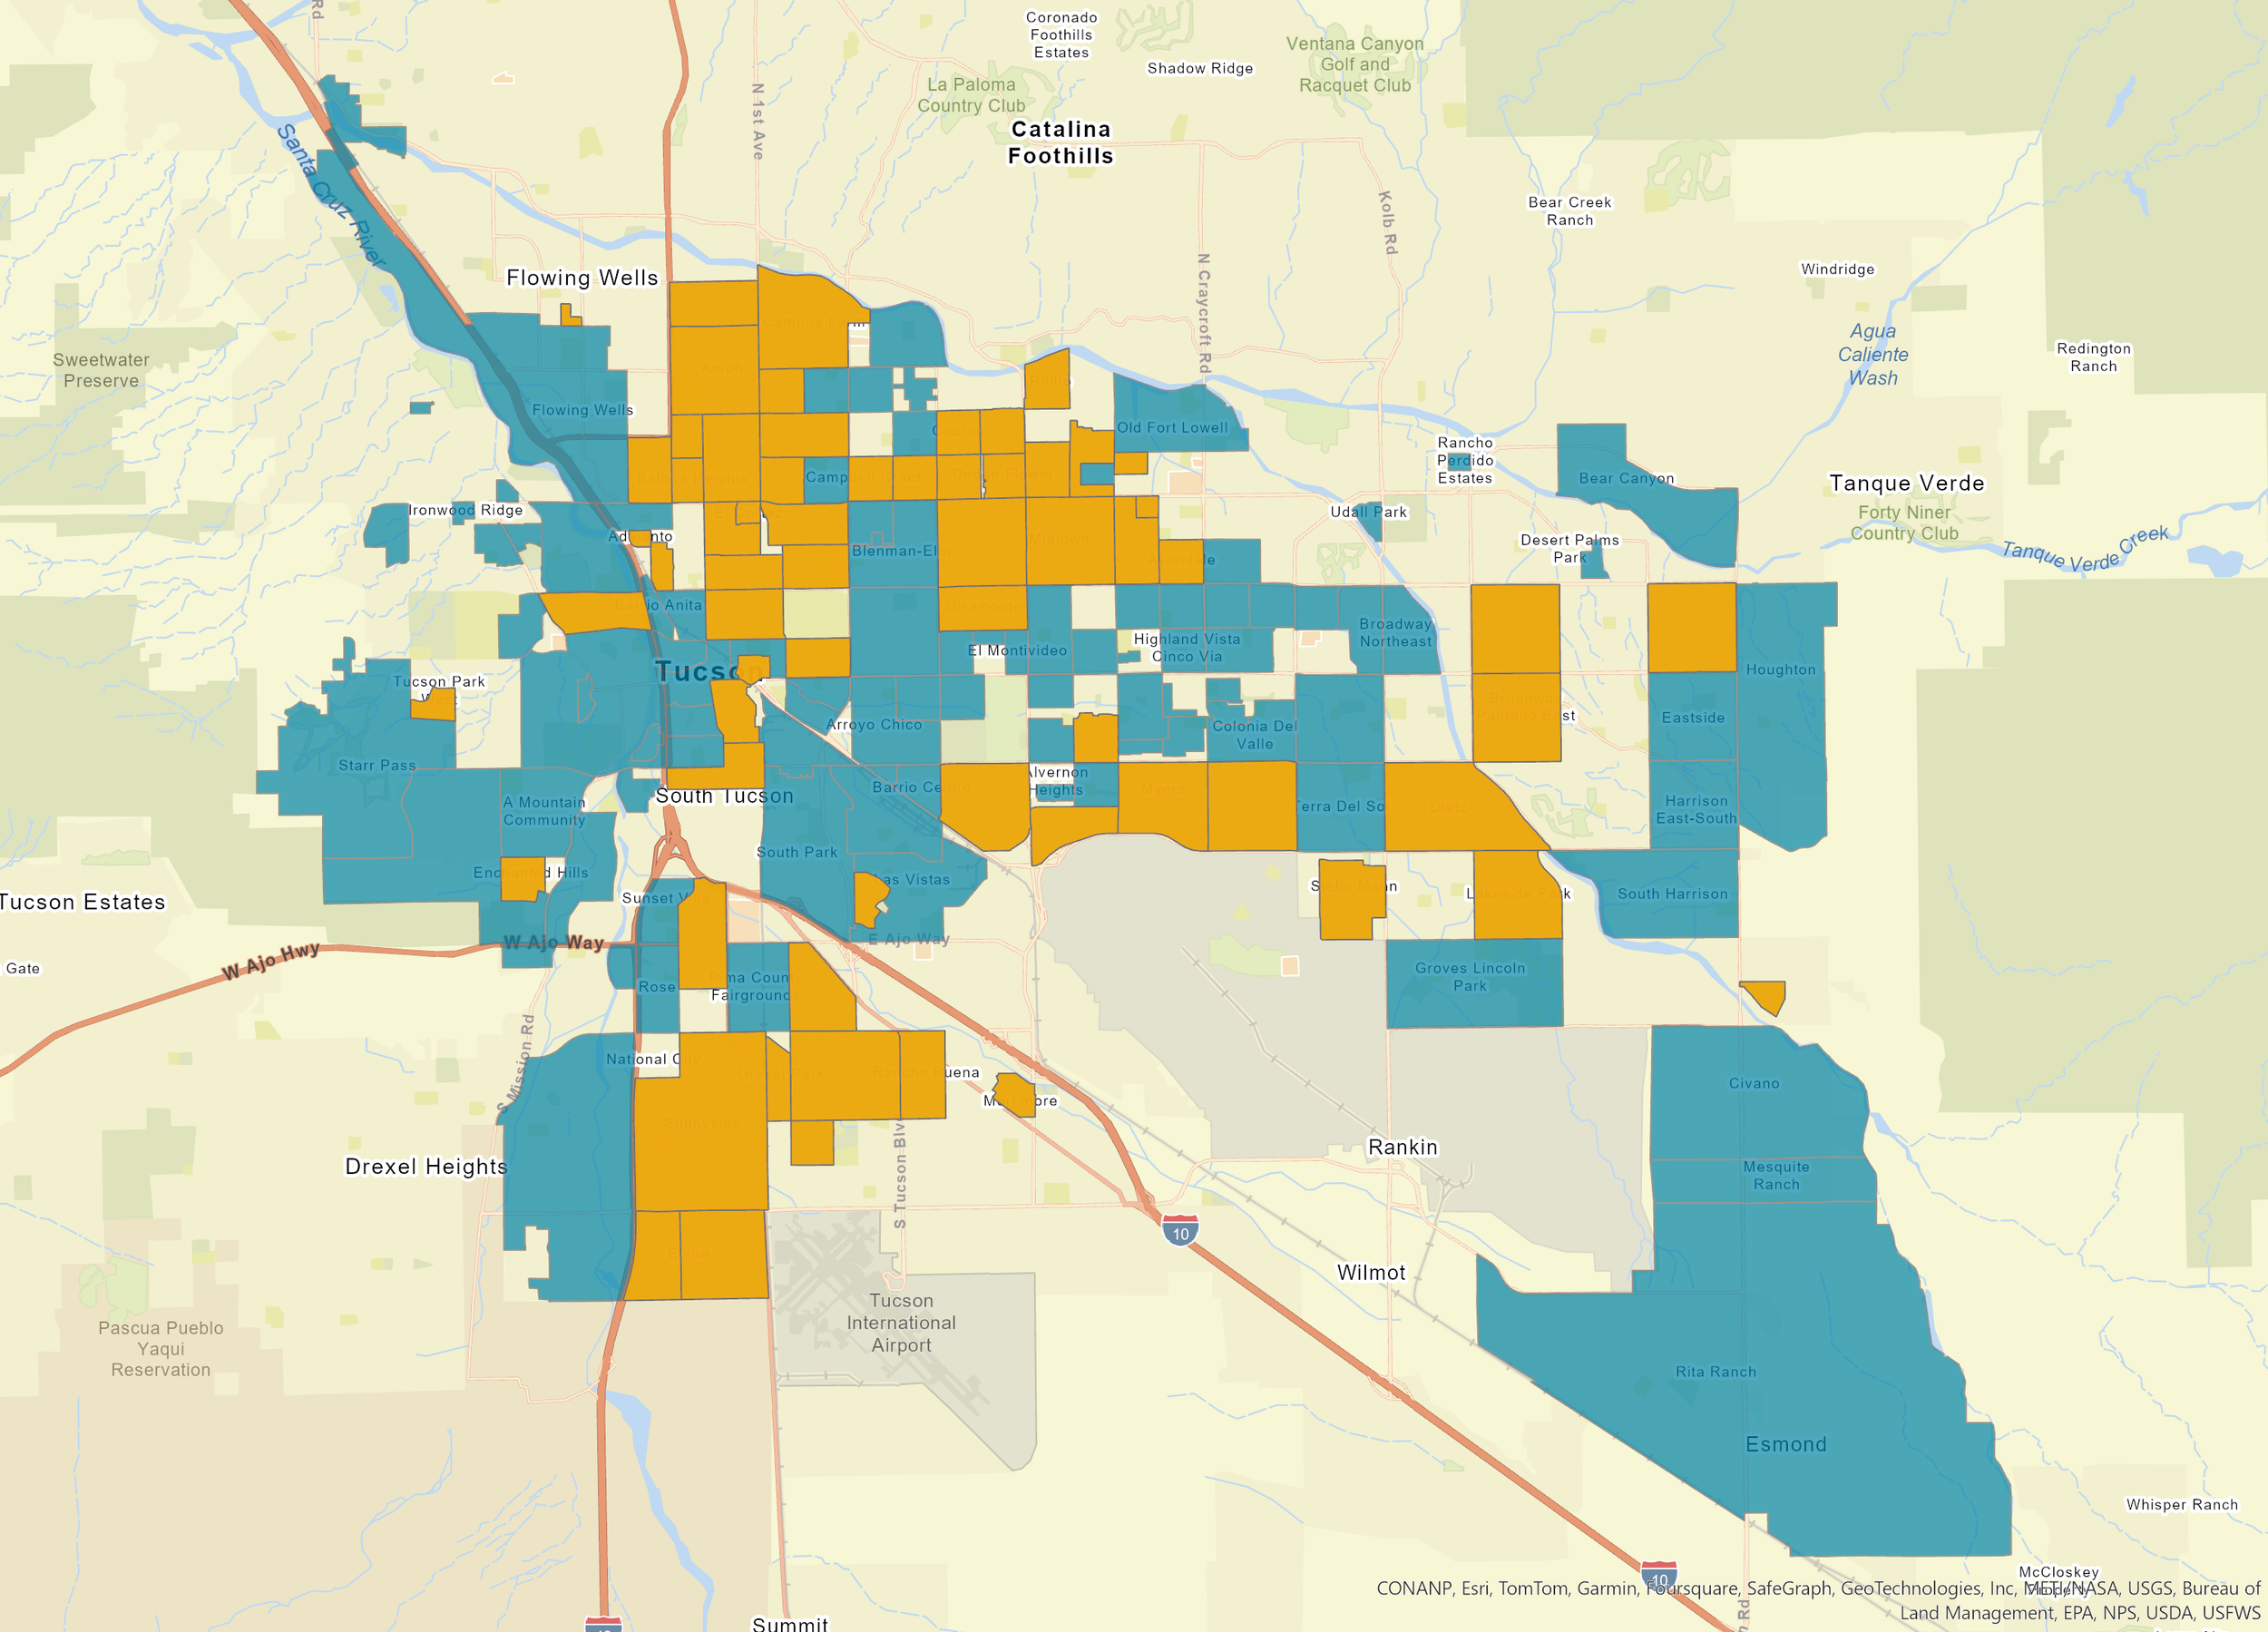
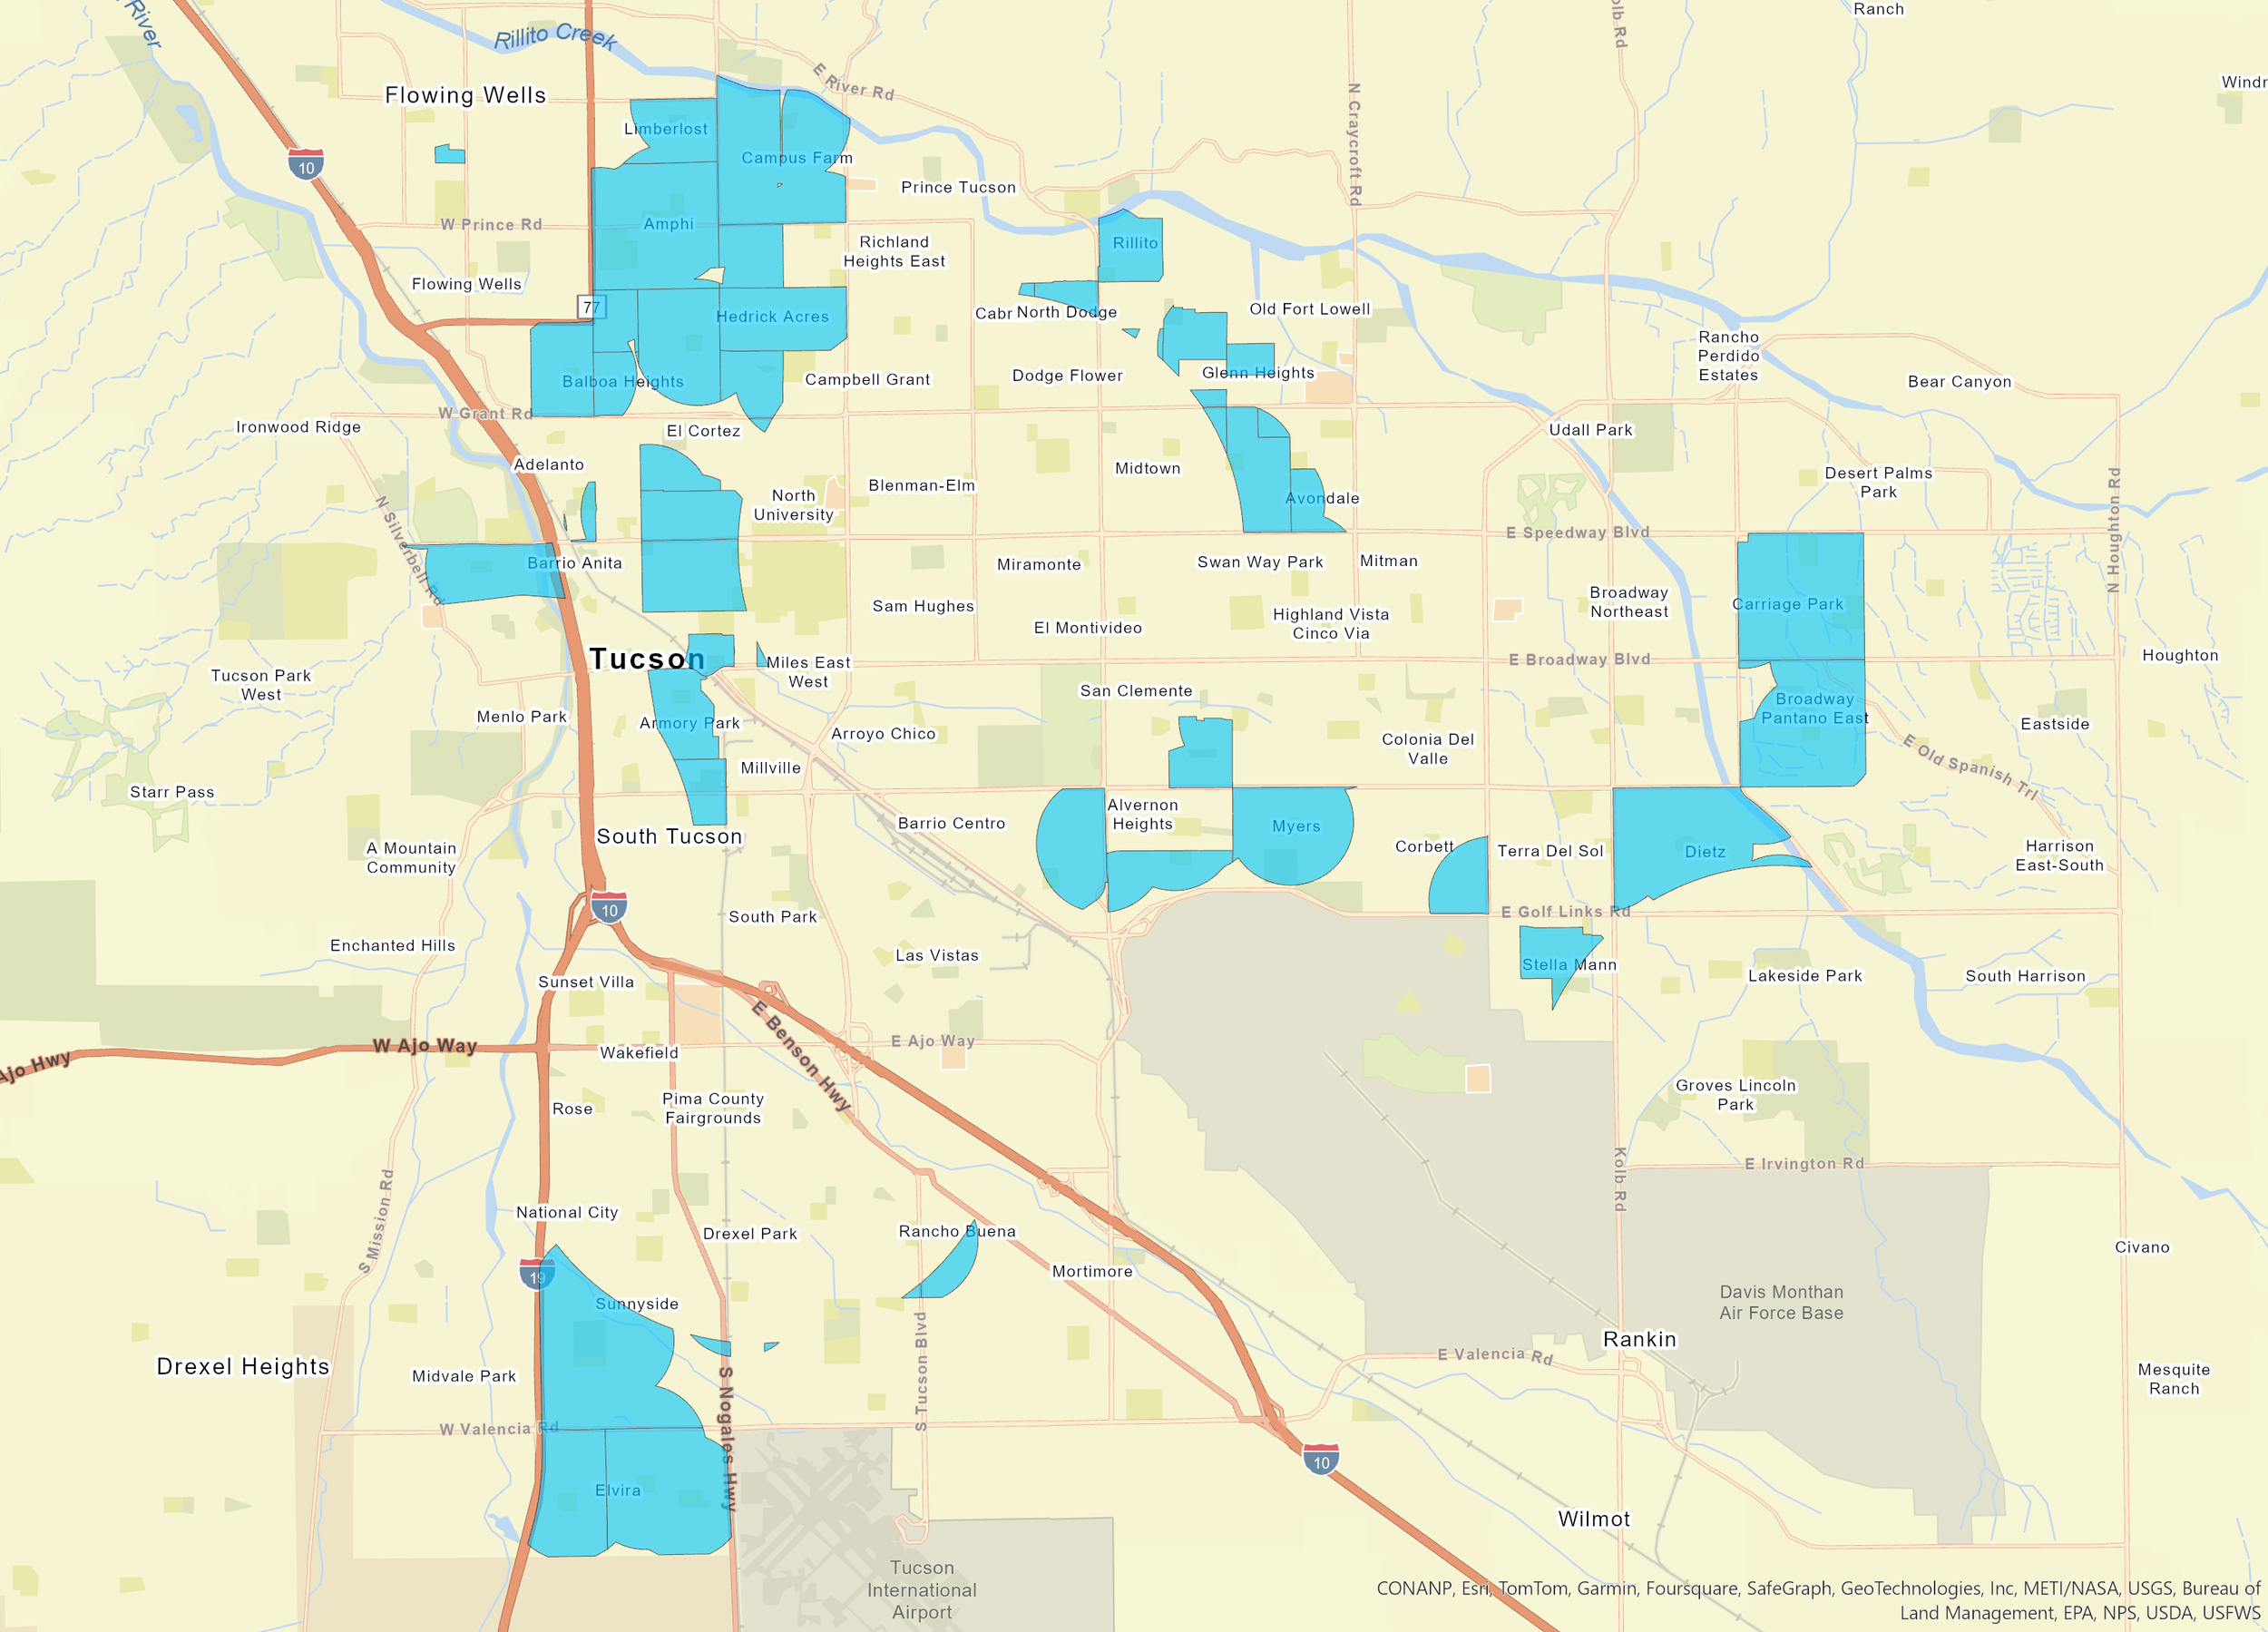
The Select tool was used to identify and select those neighborhoods with a population density of at least 5,000 people per square mile, marked in orange on the following map:
This selection consists of 65 total suitable neighborhoods based on criterion #1.
Criterion #2: The facility should be within a 0.5-mile distance from major roadways. This will create ease of access for those densely populated areas. The Buffer tool was used to create a 0.5-mile buffer around major roadways in the study area, marked in pink:
Criterion #3: The facility should be located outside a 2-mile distance from existing recycling centers. The Buffer tool was used to create a 2-mile buffer around existing recycling centers, marked in transparent blue:
The Erase tool was then used to remove areas within this buffer zone. This map shows those areas which are within 2 miles of existing recycling centers removed from the study area:
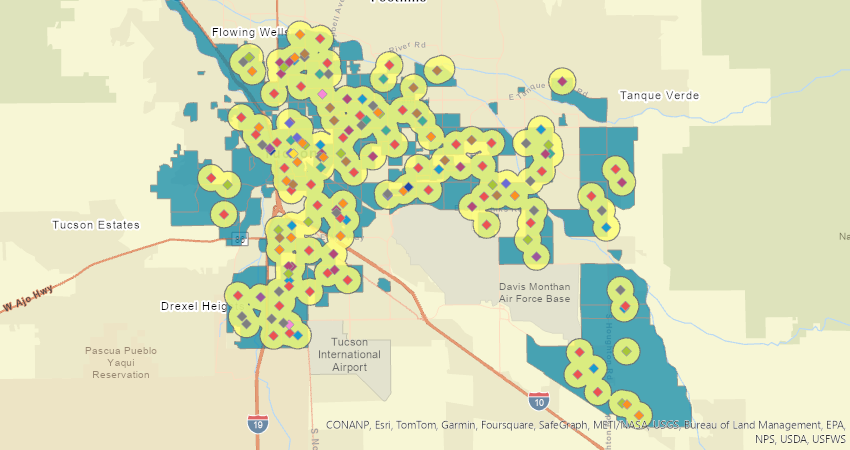
Criterion #4: The facility should be within a 0.5-mile distance from a public school. The Buffer tool was used to create a 0.5-mile buffer around all schools within the study area, marked in transparent yellow:
These four criteria are combined inputs for the applied Boolean method:
These four polygon feature classes each represent one of the criteria for the location of the new recycling facility.
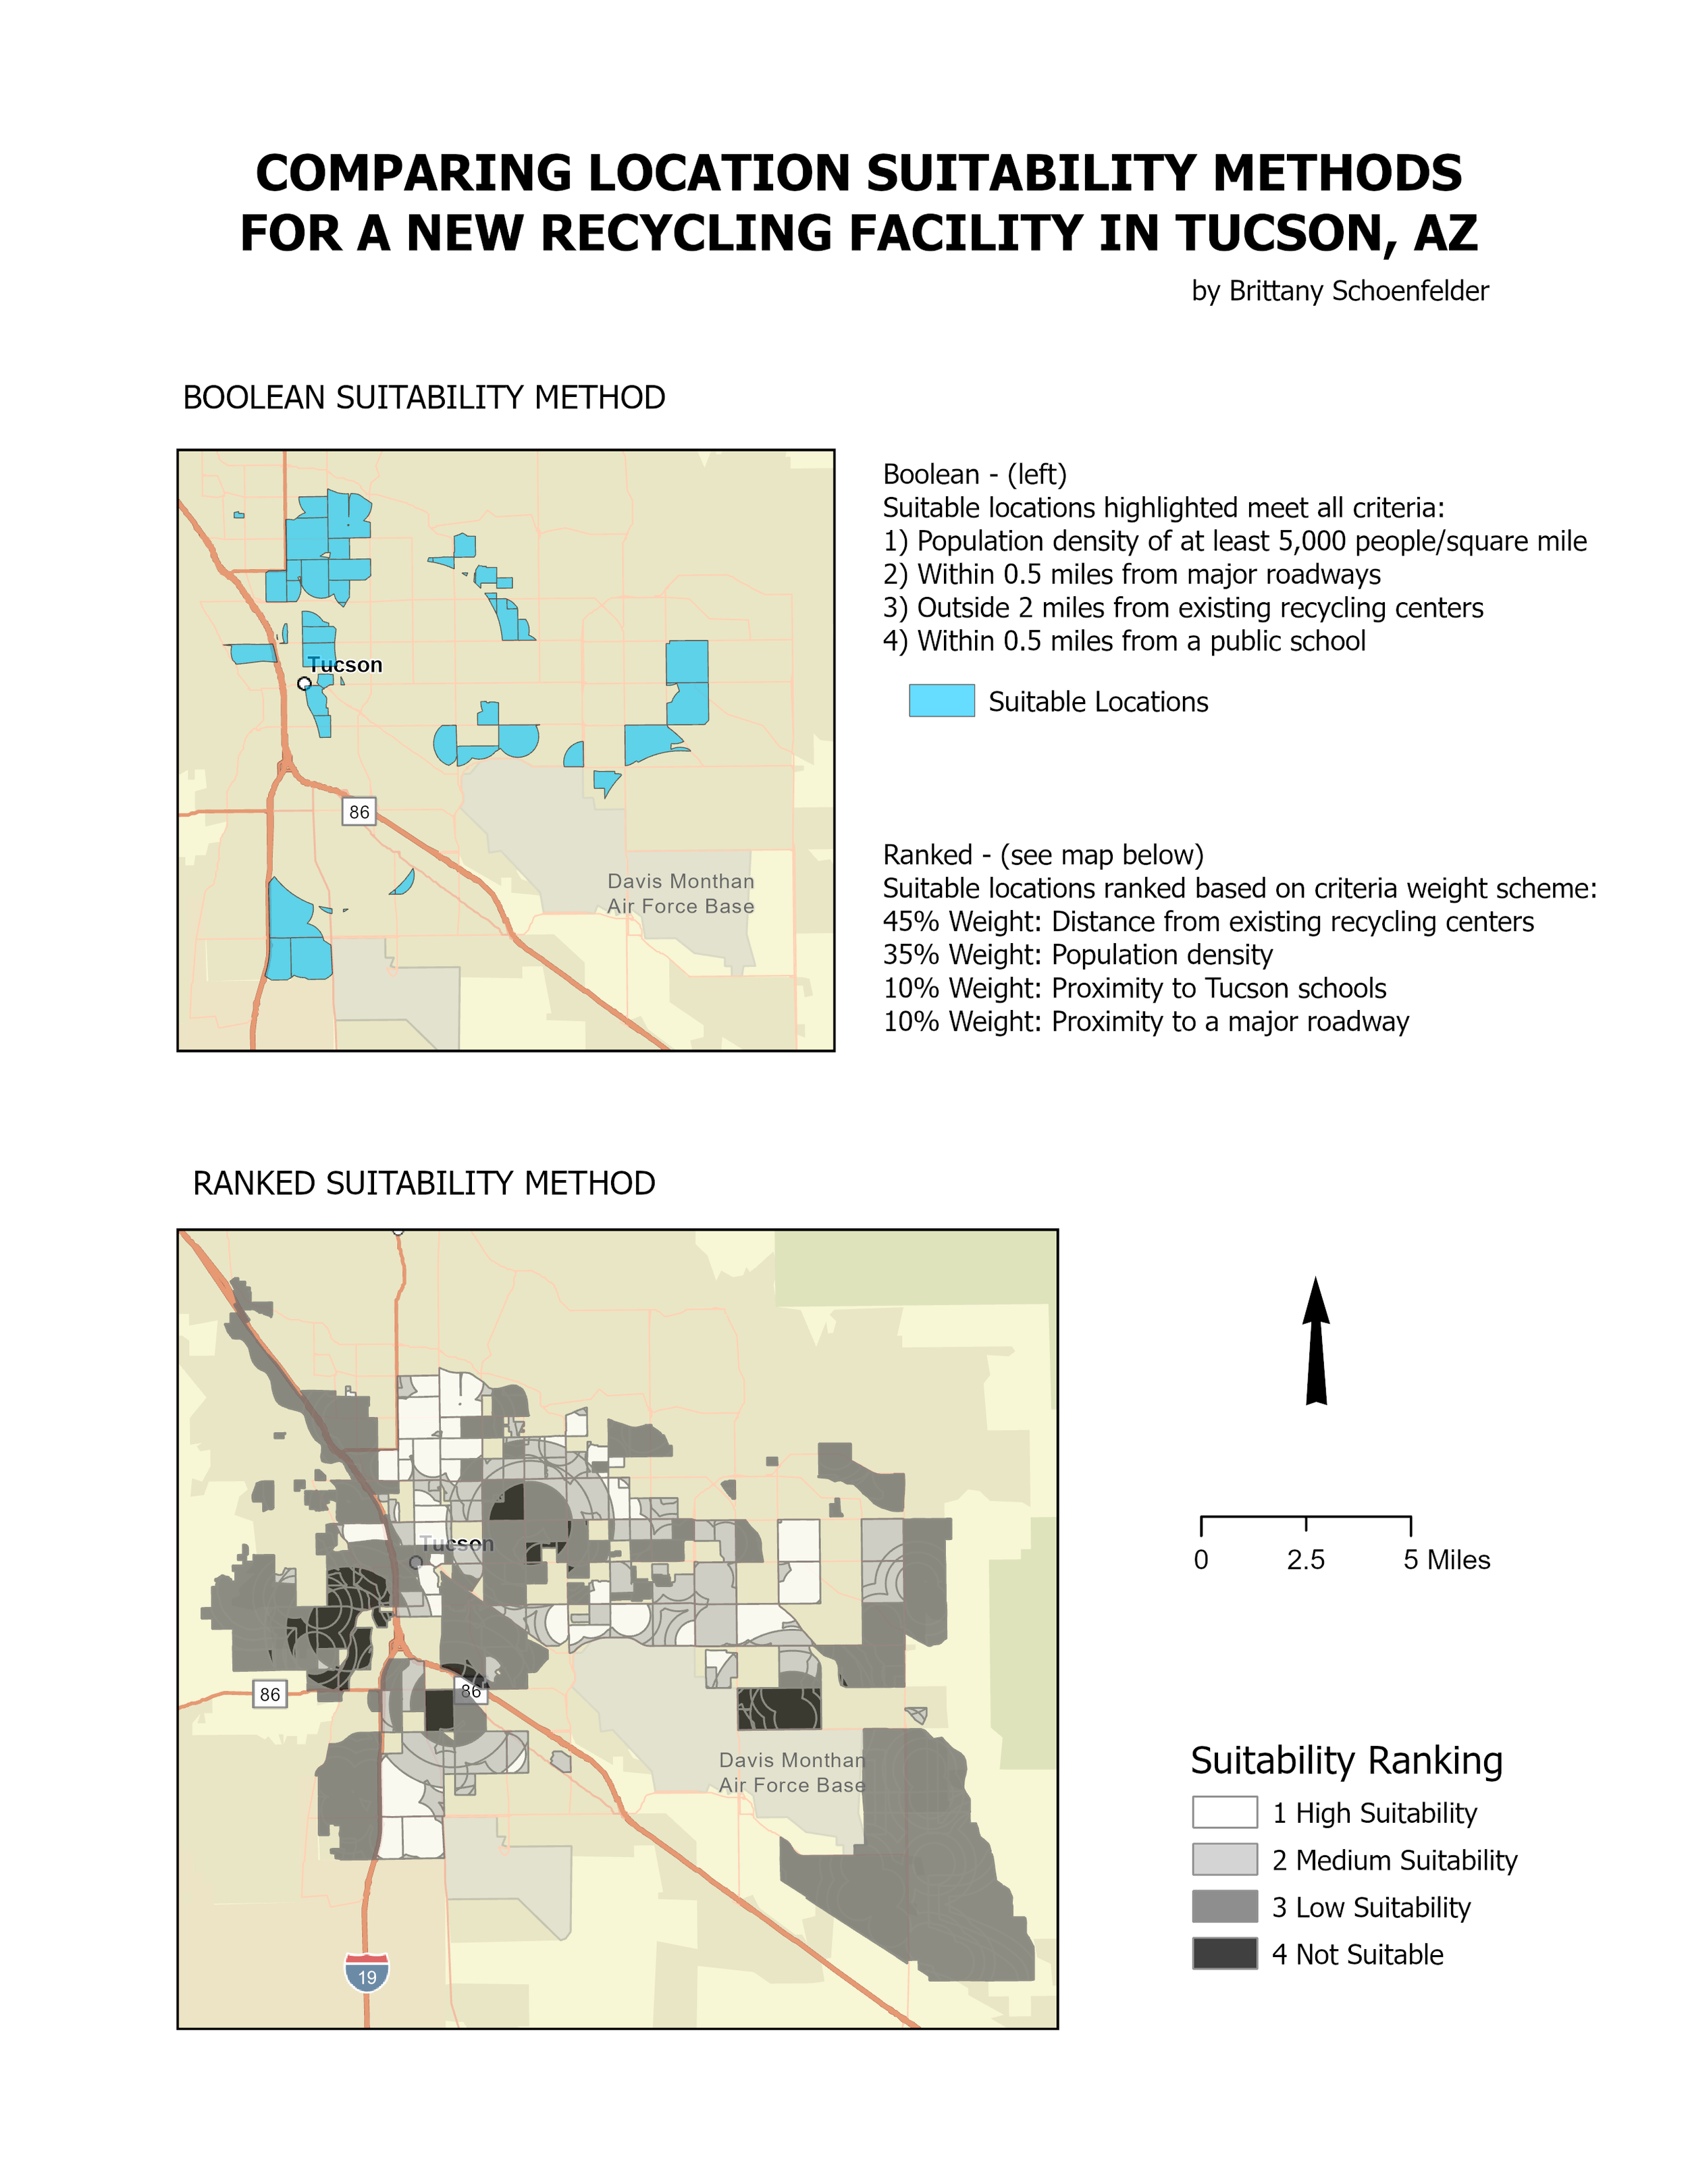
The Intersect tool was used to find a full intersection of all four criteria to determine the best suitable locations for the new recycling facility. Those areas determined as suitable locations according to all criteria are highlighted blue in the following map:
Ranked Suitability Modeling
After determining suitable locations with the Boolean method, Ranked Suitability Modeling was applied to effectively identify and rank optimal sites for a new recycling facility in Tucson. Potential locations are defined by the following criteria:
1) Distance from existing recycling centers (Further away the existing recycling facilities, the better)
2) Population density (Higher the population density, the better)
3) Proximity to Tucson schools (Closer to a public school, the better)
4) Proximity to a major roadway (Closer to a major roadway, the better)
When combining these criteria, weights are applied to each criterion based on their importance in determining the location of the recycling center. The output is based on a suitability scale of four ranks, from “1” representing highest suitability, to “4” representing unsuitable locations.
Criterion #1: Distance from existing recycling centers (the further away the existing centers, the better). The Multiple Ring Buffer tool was used to create buffers based on the following ranking scheme:
Rank 1, High Suitability, Outside of 2 miles from an existing facility
Rank 2, Medium Suitability, Within 1.5-2 miles of an existing facility
Rank 3, Low Suitability, Within 1-1.5 miles of an existing facility
Rank 4, Not Suitable, Within 1 mile of an existing facility
This map displays blue pins to represent locations of existing recycling facilities. The black radius surrounding those pins represents unsuitable locations within 1 mile of the existing facilities, ranked 4. The next lighter gradient radius ring represents rank 3, of low suitability, within 1-1.5 miles of a facility, and so on through rank 1 in white.
Criterion #2: Population density (Higher the population density, the better). Locations were then ranked based on population density:
Rank 1, High Suitability, with a population density of more than 5,000
Rank 2, Medium Suitability, with a population density between 4,500 and 5,000
Rank 3, Low Suitability, with a population density of between 4,000 and 4,500
Rank 4, Not Suitable, with a population density of less than 4,000
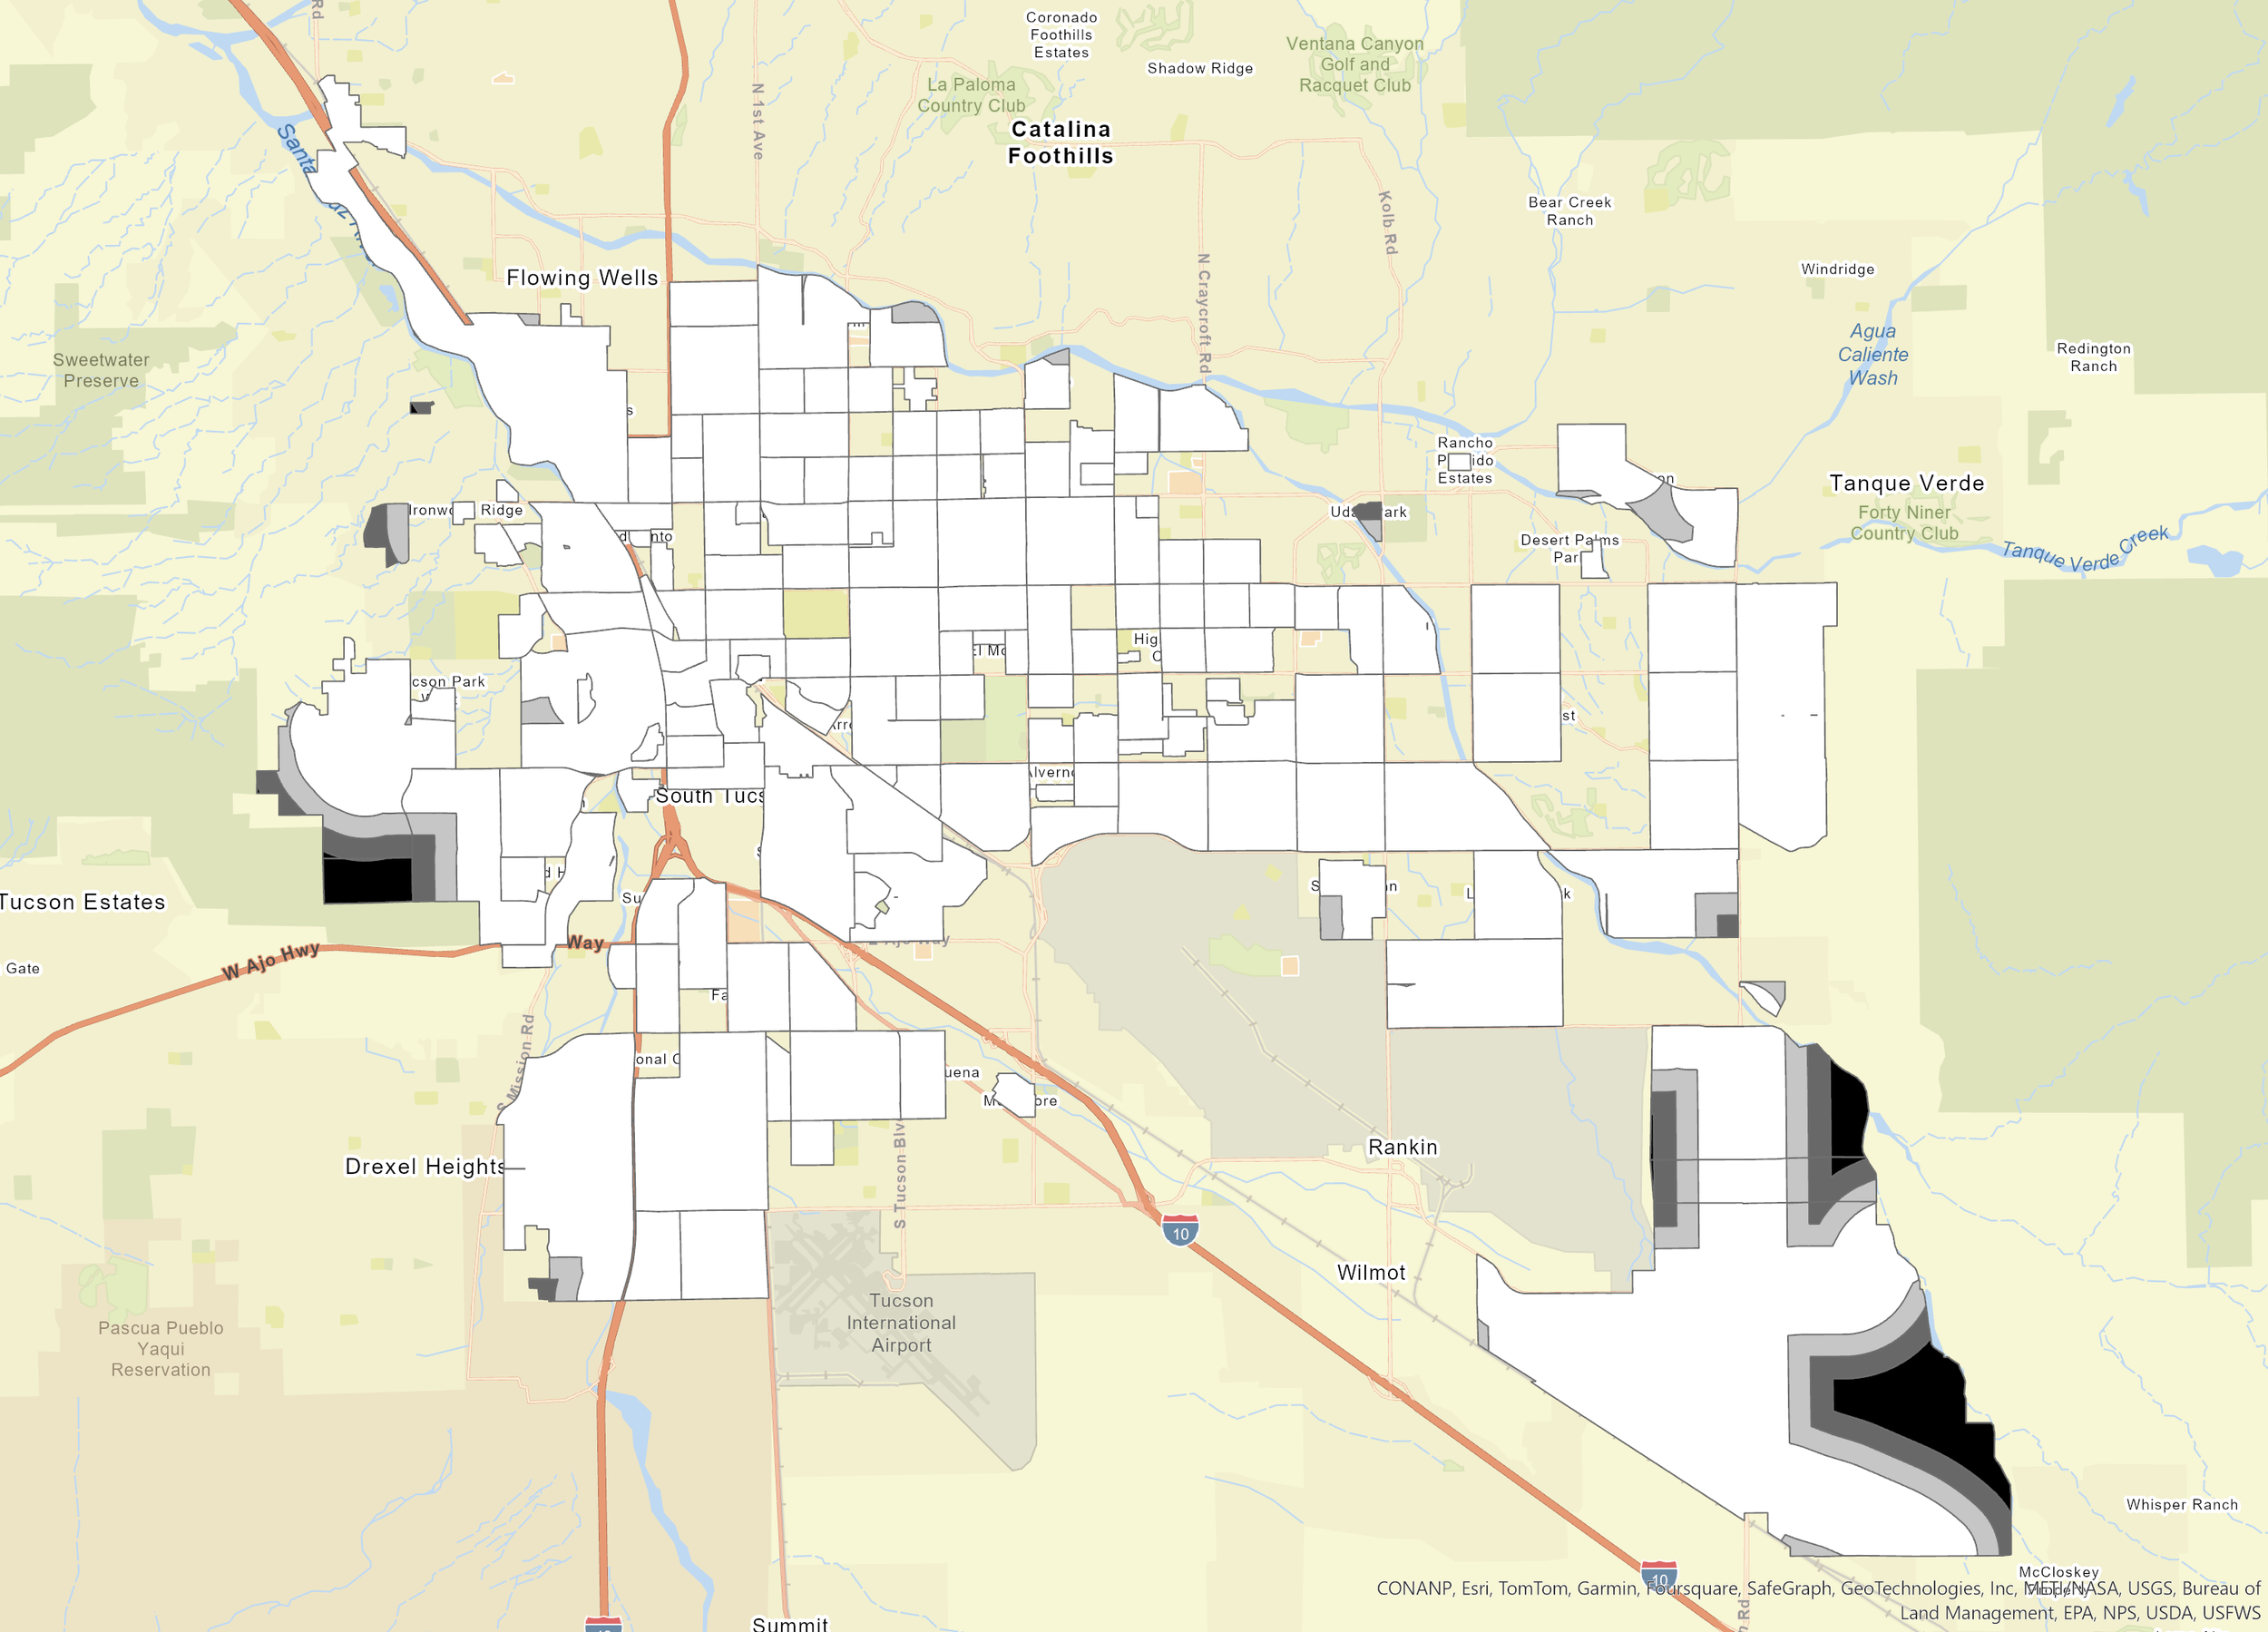
The output map displays Tucson neighborhoods ranked by population density, with the white representing neighborhoods of rank 1 (high suitability), to the darkest black representing neighborhoods of rank 4 (unsuitable according to population density).
Criterion #3: Proximity to Tucson schools (Closer to a public school, the better). Rank_C
Rank 1, High Suitability, Within 0.5 miles from a school
Rank 2, Medium Suitability, Within 0.5-0.75 miles of a school
Rank 3, Low Suitability, Within 0.75-1 miles of a school
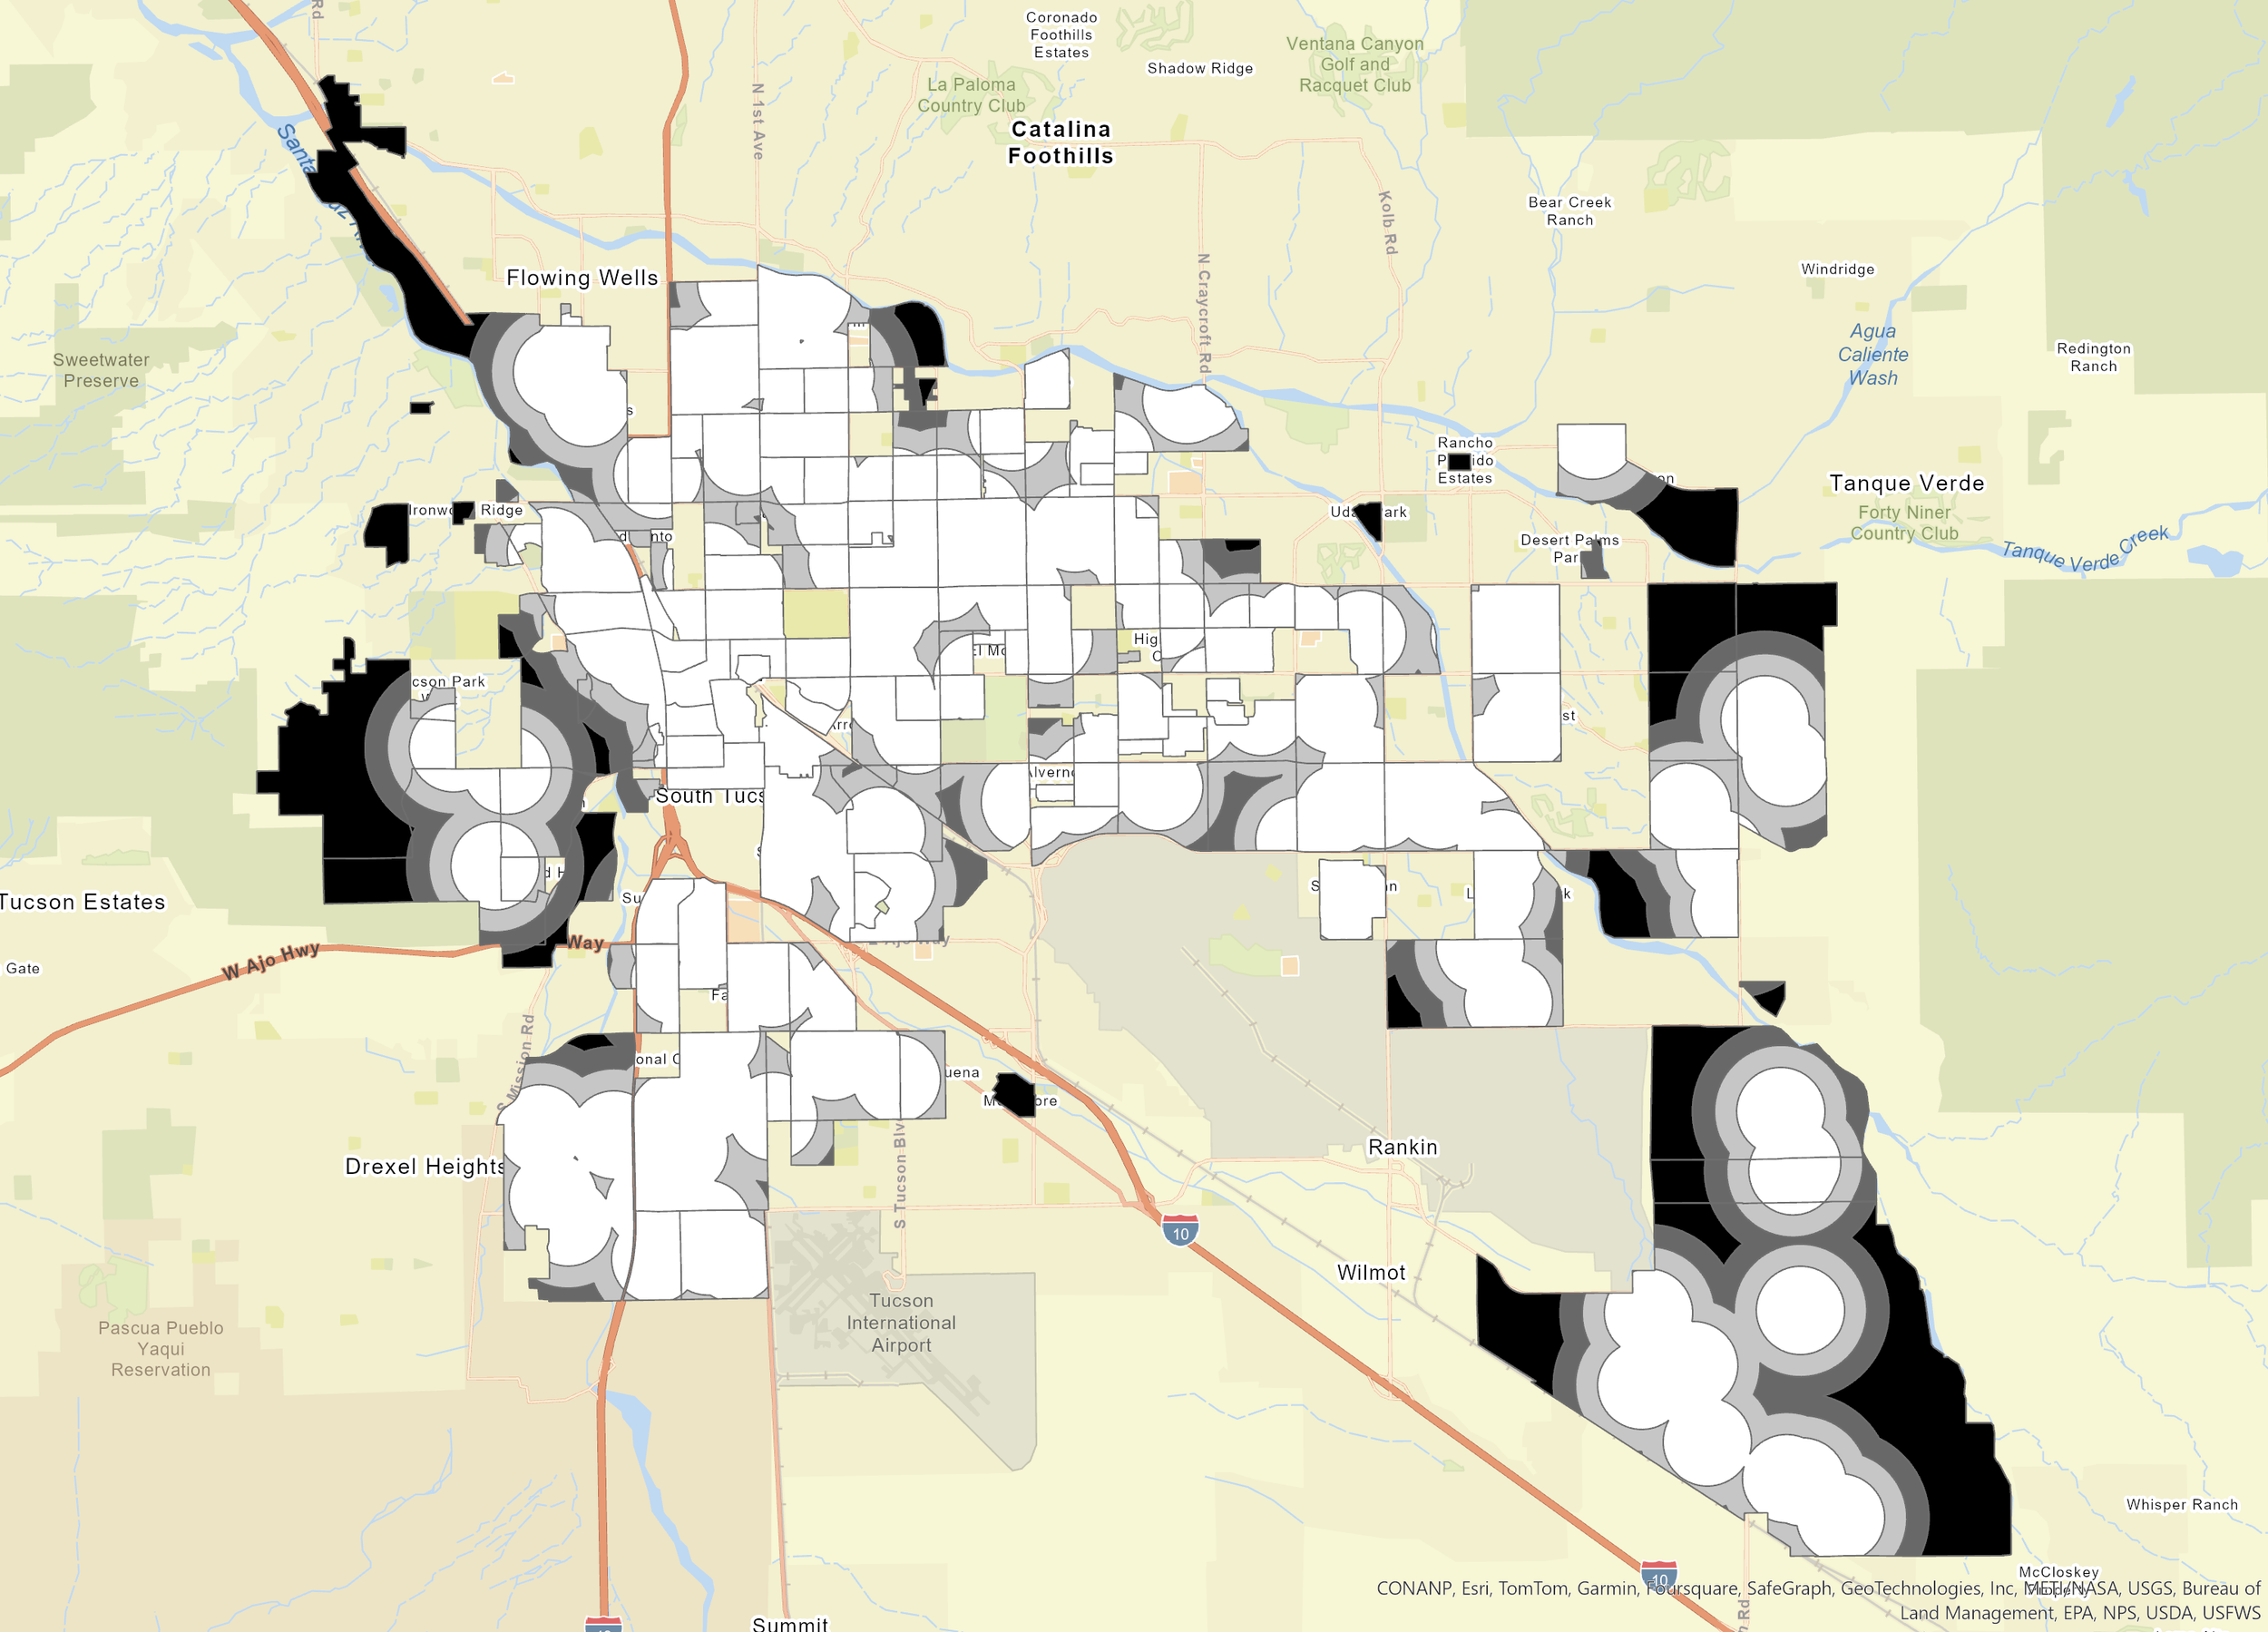
Rank 4, Not Suitable, Farther than 1 mile of a school
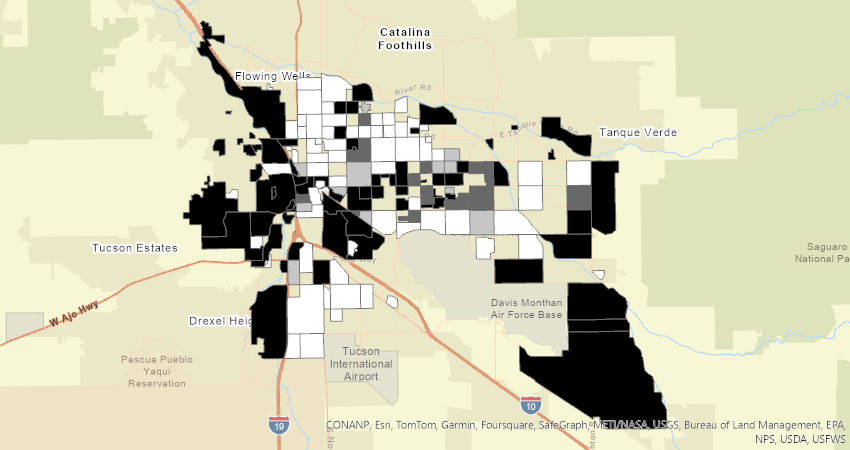
Ranking in this map goes from rank 1 (high suitability) in white, to rank 4 (not suitable) in black, according to proximity to schools.
Criterion #4: Proximity to a major roadway (Closer to a major roadway, the better).
Rank 1, High Suitability, Within 0.5 miles from a major roadway
Rank 2, Medium Suitability, Within 0.5-0.75 miles of a major roadway
Rank 3, Low Suitability, Within 0.75-1 miles of a major roadway
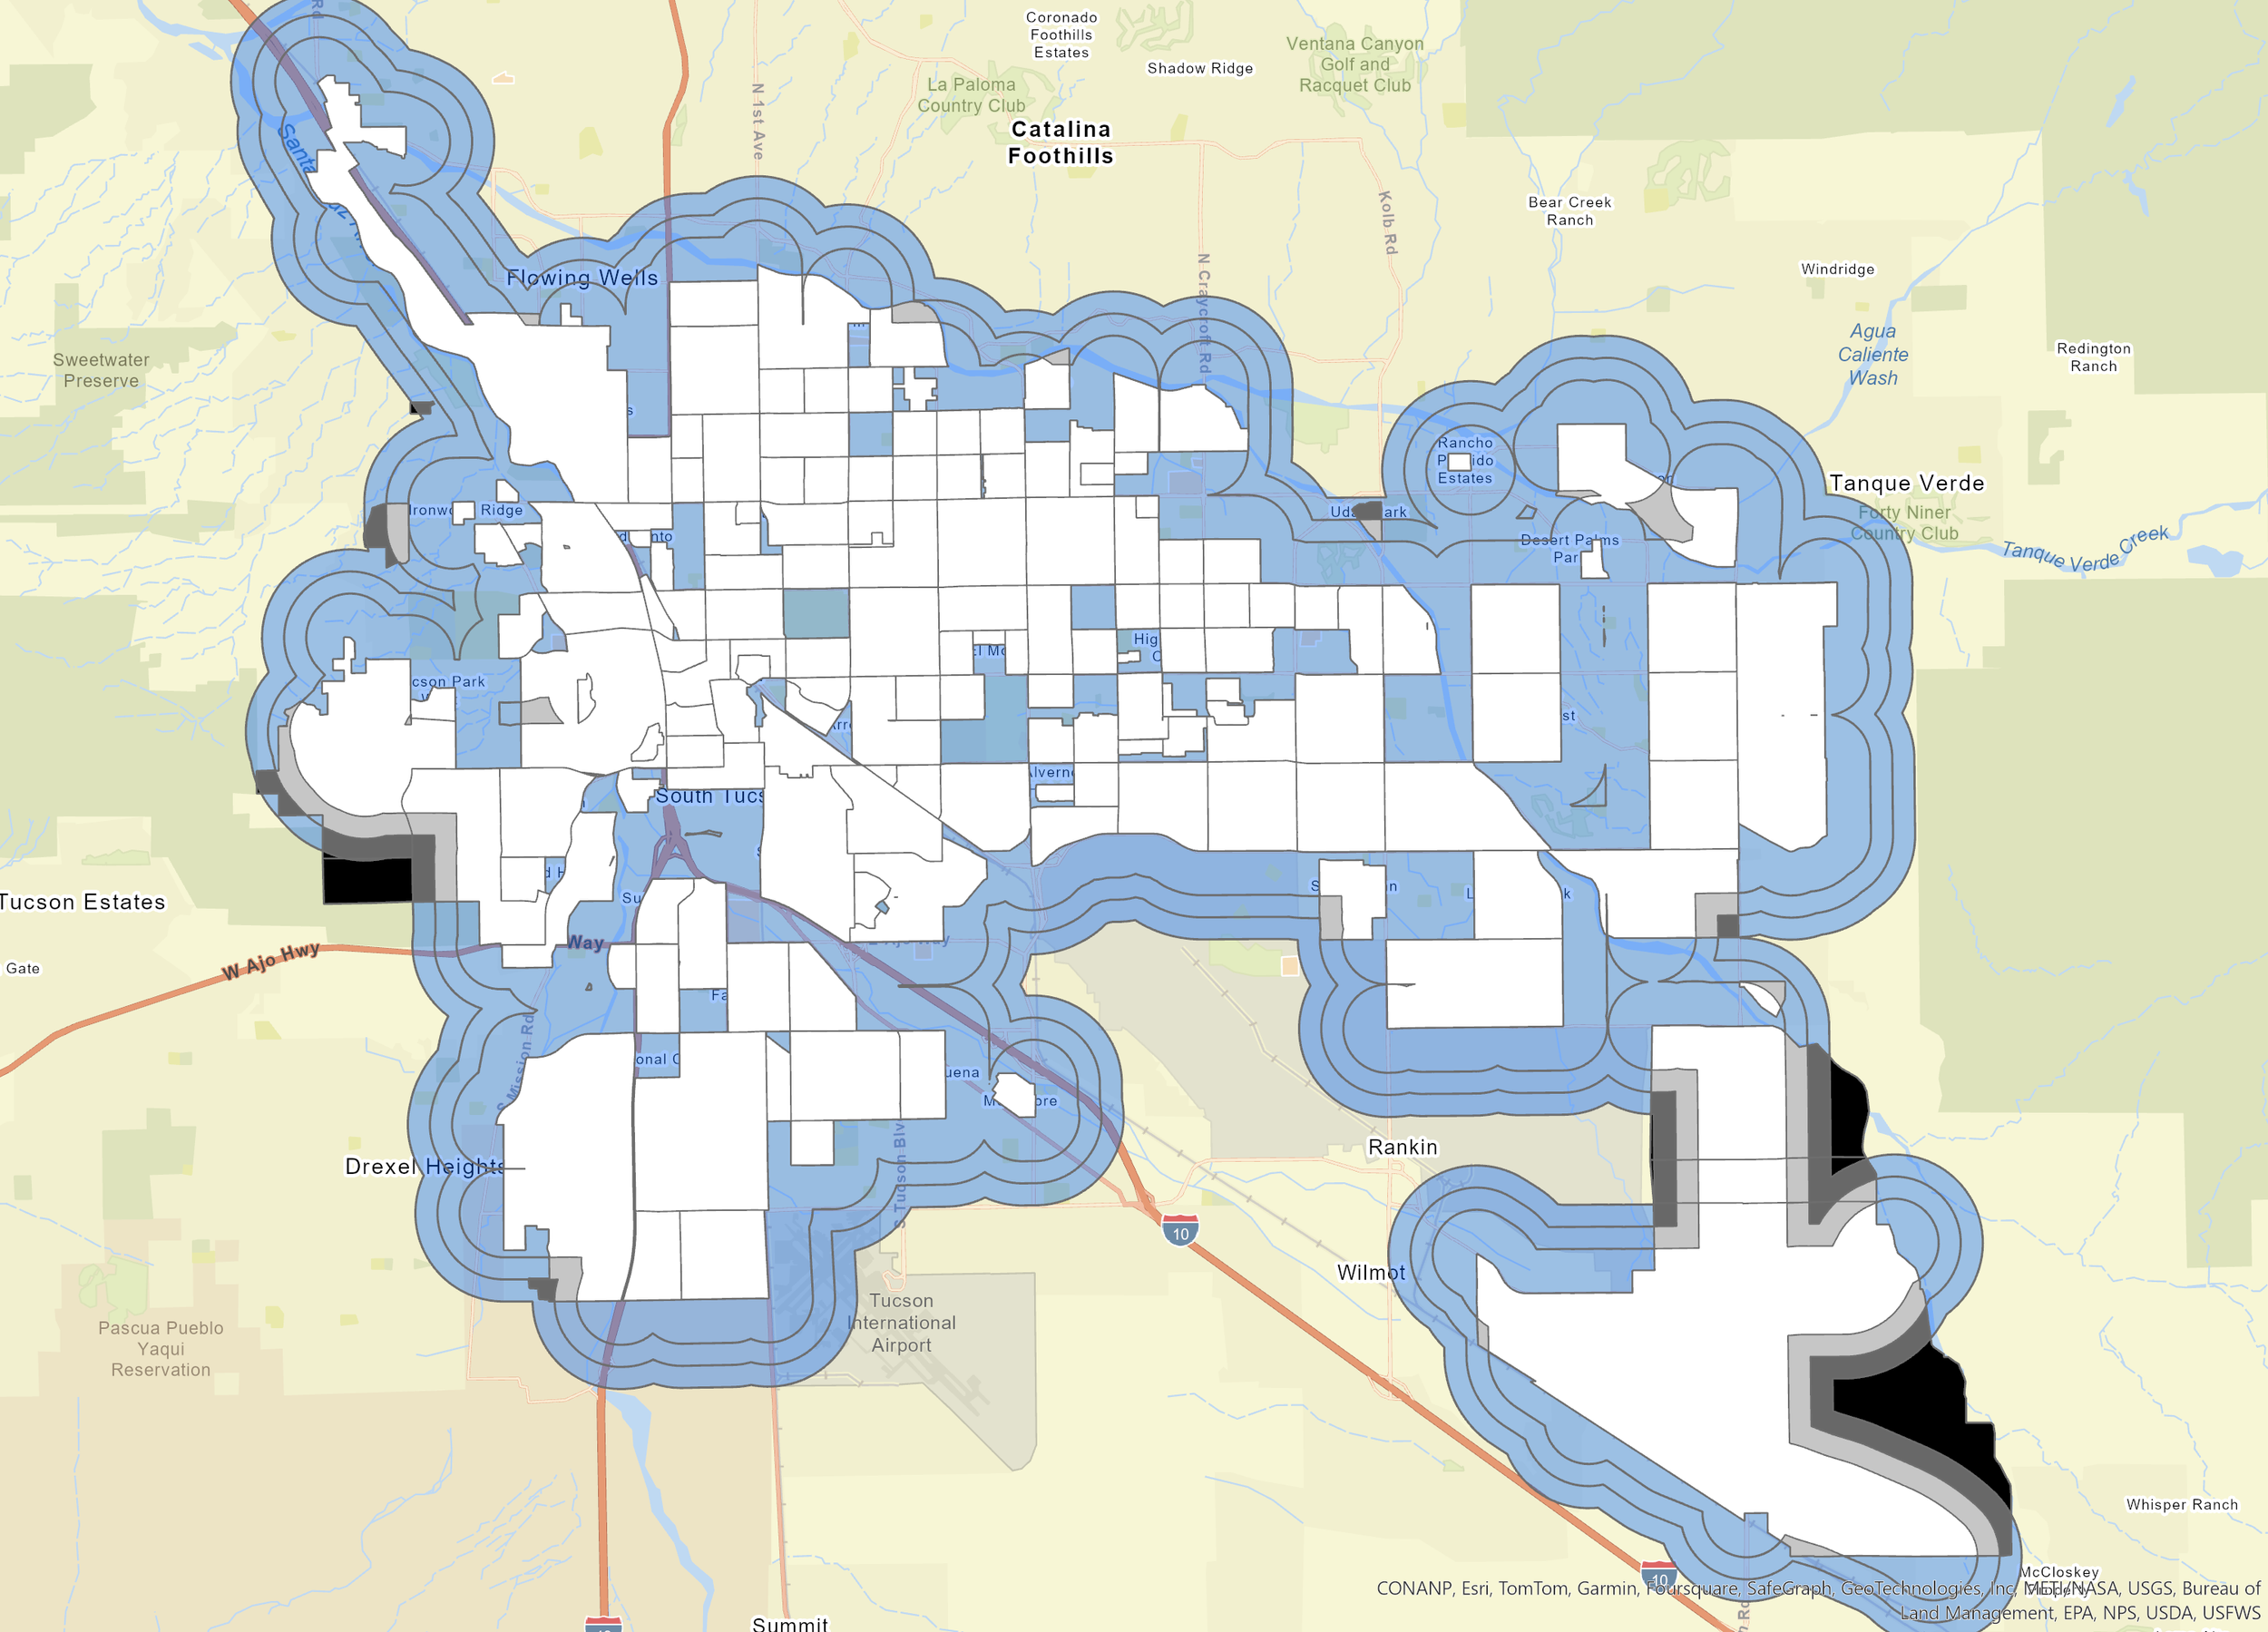
Rank 4, Not Suitable, Farther than 1 mile of a major roadway
This map reflects findings from the Boolean Method in regards to proximity to major roadways; most of the study area meets the criterion of being within 0.5 miles of a major roadway. The light blue areas exist outside of the study area. The Multiple Rings Buffer tool outputs rings by rank around major roadways, which can be seen here intersecting the study area only in a few areas (such as the southeast portion of the map). This was expected, as Tucson has a relatively small surface area with many major roadways. Perhaps a tighter range in distance would produce an output with larger rings for a more appealing visual. However, a new recycling facility would likely necessitate that minimum distance to remain at 0.5 miles from a major roadway. It is therefore beneficial overall that the majority of the study area ranks high in suitability according to the proximity to major roadways.
These four prepared ranked criteria were all symbolized the same for visual reference side-by-side. Ranked Tucson areas based on suitability appear according to this color scheme:
In combining these ranked criteria to identify suitable locations for a new recycling facility, weights were assigned to the 4 criteria as follows:
45% Weight: Criterion #1, Distance from existing recycling centers
35% Weight: Criterion #2, Population density
10% Weight: Criterion #3, Proximity to Tucson schools
10% Weight: Criterion #4, Proximity to a major roadway
These weights were applied based on the reasoning that both school and major roadways cover the majority of the study area already and therefore demand less prioritization than population density and distance from existing recycling facilities.
The Ranked Suitability output map (above) has combined all ranked and then weighted criteria, showing more options for suitable locations based on the weighted criteria.
Other potential criteria for this specific analysis include consideration of less densely populated areas and proximity to other facilities like grocery stores, sports arenas, Amazon warehouses, and existing landfills. These areas each have some demand for such facility nearby. Of course, applying different weight schemes to the criteria in a Ranked Suitability method would give different outputs as well. Overall, the Boolean Suitability Method seems to be a better fit for an area as small as Tucson. However, refining criteria and weight schemes in the Ranked Suitability Method would provide a more extensive analysis.
Sources:
“Schools Located in Pima County.” Arcgis.Com, Pima County Information Technology Department - Geographic Information Systems, 24 Nov. 2016, www.arcgis.com/home/item.html?id=e6419538636645579e0c473b8d1568d3.
“Locations of Neighborhood Recycling Centers.” City of Tucson, City of Tucson, 2024, www.tucsonaz.gov/Departments/Environmental-and-General-Services/Residential-Services/Recycling-Services/Neighborhood-Recycling-Centers.
“Subdivisions - Open Data.” Tucson Open Data, City of Tucson, 8 Aug. 2018, gisdata.tucsonaz.gov/datasets/a92d882f76e141c294d0cee4f0e4189e_25/explore.
Pima County Open Data, Pima County Geospatial Data Portal, 3 Mar. 2020, gisopendata.pima.gov/datasets/a035b88bcabd4c07b3dbce5414e639ac/about.
“Neighborhood Population Statistics.” Tucson Open Data, City of Tucson, 20 Nov. 2019, gisdata.tucsonaz.gov/datasets/a4ed8b6bf0ad4515bfc43df83175e40f_0/explore.
“ArcGIS pro Geoprocessing Tool Reference.” ArcGIS Pro Geoprocessing Tool Reference-ArcGIS Pro | Documentation, ArcGIS Pro, 2024, pro.arcgis.com/en/pro-app/latest/tool-reference/main/arcgis-pro-tool-reference.htm.
O’Sullivan, David, and David Unwin. Geographic Information Analysis. Wiley, 2014.


